

Blog
Reps and Warranties Insurance 2022: First Quarter Round-Up
 Emily Maier
 Apr 17, 2022

Now that the first quarter of 2022 is at an end, we will show you quarter-on-quarter comparisons on the broader picture around RWI Pricing. Let’s look at a recap on some of the emerging trends impacting M&A activity and how that will affect pricing going forward.
Last Quarter of 2021 versus First Quarter of 2022
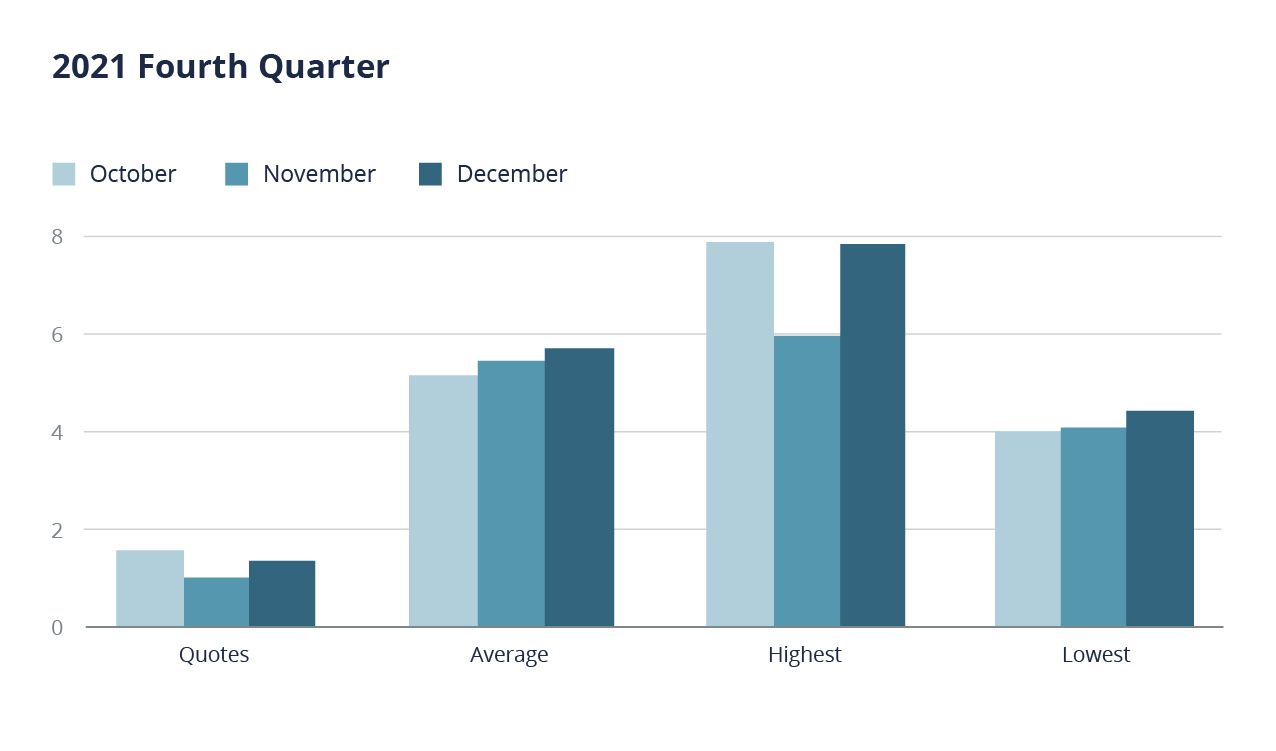
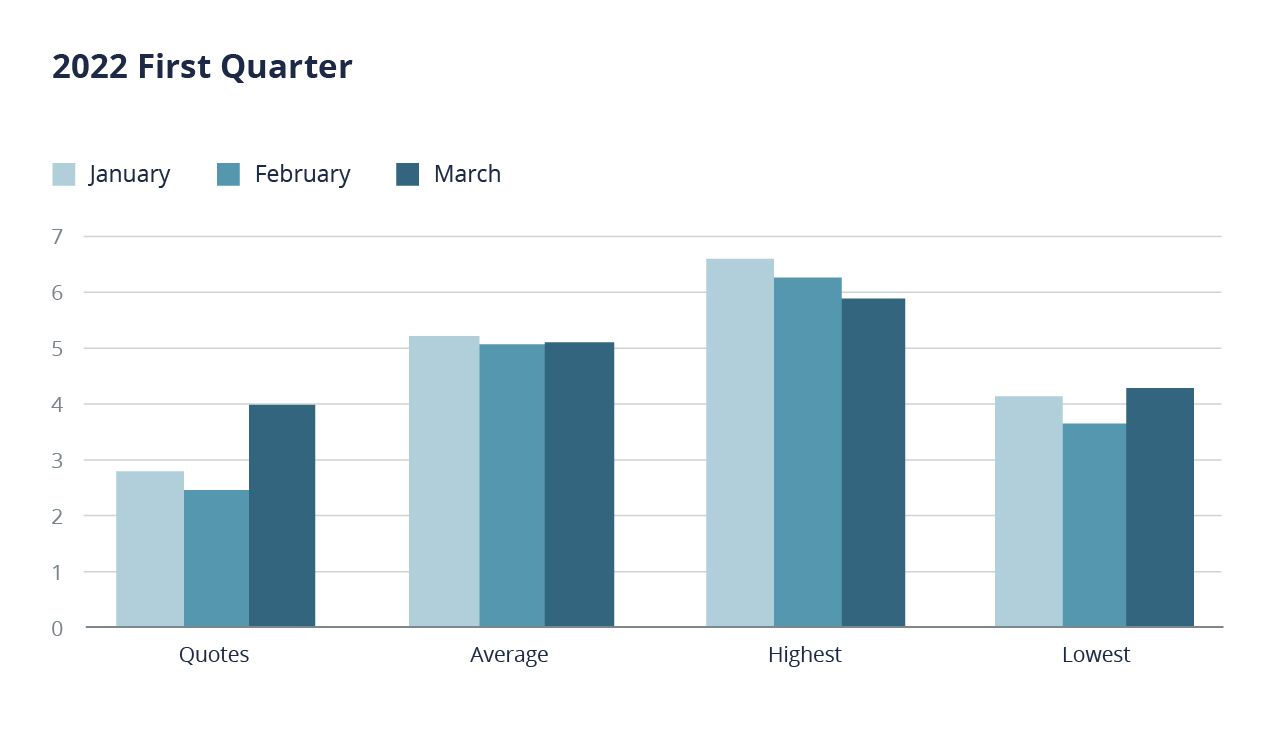
The following graphs depict four of the most relevant metrics for the quarter that ended December 31, 2021, and the quarter ended March 31, 2022. Below the graphs, we break down the metrics into what it means and why it’s important.
| # Quotes | Average | Highest | Lowest | |
|---|---|---|---|---|
| Oct | 1.6 | 5.2 | 7.91 | 4 |
| Nov | 1.1 | 5.5 | 6 | 4.1 |
| Dec | 1.4 | 5.76 | 7.9 | 4.5 |
| # Quotes | Average | Highest | Lowest | |
|---|---|---|---|---|
| Jan | 2.8 | 5.2 | 6.6 | 4.15 |
| Feb | 2.5 | 5.1 | 6.29 | 3.64 |
| March | 4 | 5.12 | 5.9 | 4.3 |
The Average Number of Quotes
By the end of the first quarter, we were back to competitive numbers, meaning nearly all risks have multiple options from which to choose.
Average Price
The overall average price for the first $5 million has not decreased as much as we would like but is still lower than the last quarter of 2021.
Highest and Lowest
We can see the difference competition makes in this section more clearly than in the average price. The very high highs of the last quarter were long gone by March, and the lowest continues between 4–4.5% which is where we think that pricing is headed.
First Quarter of 2021 versus First Quarter of 2022
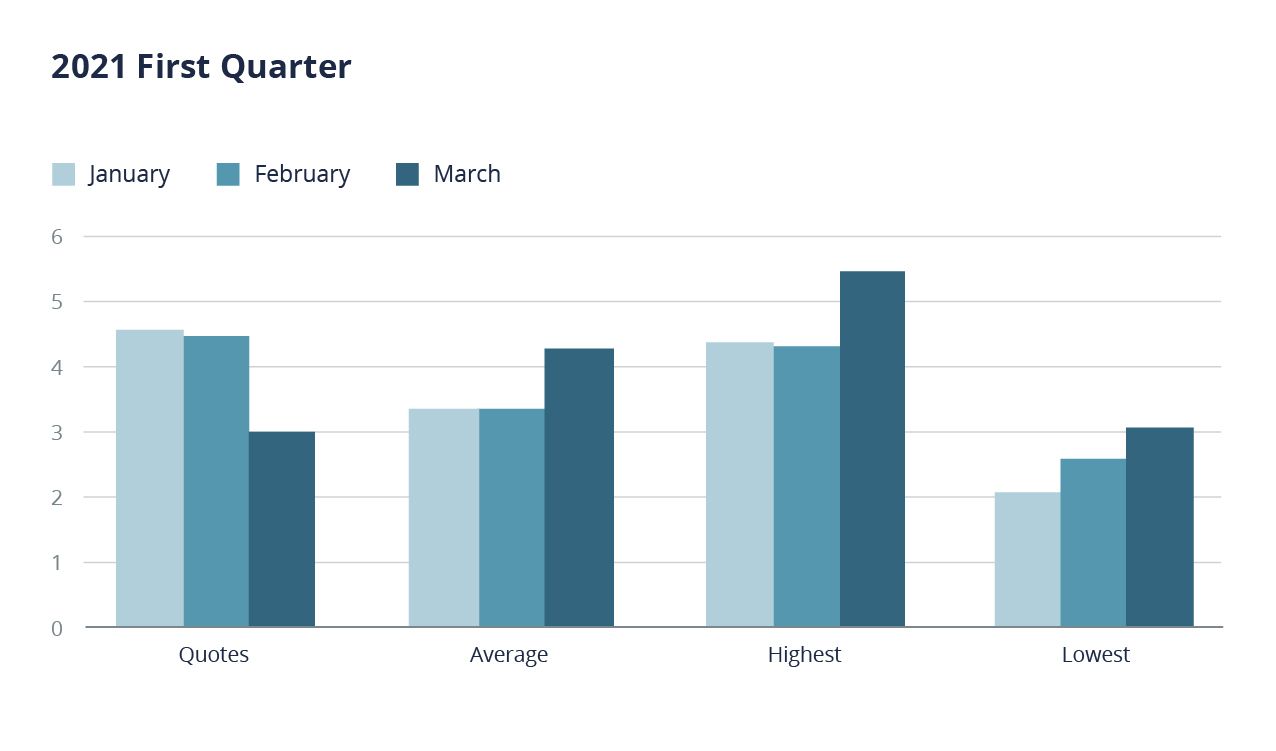
The following graphics compare the first quarter of 2021 with the first quarter of 2022. Next, we’ll take a deeper look at these metrics and what this might mean.
| # Quotes | Average | Highest | Lowest | |
|---|---|---|---|---|
| Jan | 4.6 | 3.4 | 4.4 | 2.13 |
| Feb | 4.5 | 3.4 | 4.35 | 2.6 |
| March | 3 | 4.3 | 5.5 | 3.06 |
| # Quotes | Average | Highest | Lowest | |
|---|---|---|---|---|
| Jan | 2.8 | 5.2 | 6.6 | 4.15 |
| Feb | 2.5 | 5.1 | 6.29 | 3.64 |
| March | 4 | 5.12 | 5.9 | 4.3 |
Average Number of Quotes
While the number of quotes for each risk January and February of 2022 were well below those of the same quarter in 2021, by March of 2022, we are back to first-quarter 2021 numbers. This is the result of several factors:
- Deal flow in the first quarter of 2022 is closer to deal flow in the first quarter of 2021 than the last quarter of 2021 by a significant amount, meaning there is more bandwidth to quote.
- Underwriters have been on a hiring spree and while new people take a while to get up to speed by March there were more bodies on deck who could quote.
- Since the last quarter of last year there have been four new entrants to the underwriting market. Whilst two of those are focused on small deals, this is still a significant increase in capacity.
Looking at the Second Quarter and Beyond
Several factors impact pricing in RWI beyond the specifics of a transaction.
- Overall submission rate
- Availability of RWI capital to apply to risks
- Impact of the overall economy on the potential to earn income from the investment of premium
- Claims rates
- Competition
Of these, the following two factors affect different underwriters to a greater or lesser degree.
The ability to grow income from premium dollars has the greatest impact on the largest multi-line insurers, the AIGs and Chubbs of this world. The smaller mono line MGAs (managing general agencies that only write RWI) do not have access to as much premium to invest. There is also a lag time to this kind of impact and maybe more for 2023 than 2022.
Claims rates are markedly different from carrier to carrier. RWI policies have a six-year tail, meaning the underwriter is potentially open to a claim coming in for six years. While most claims come in the first couple of years, a company could have potential claims activity for all six. If we compare the claims burden of an underwriter who has been placing business since 2015 and one who’s placed business since 2019 or even 2021, we can see their ratios and subsequent pricing pressures are very different.
However, it is the overall submission rate that will likely be the biggest driver of pricing, as we saw in the last quarter of 2021.
What Will Impact Submission Rates?
Potential Interest Rate Increases
We have seen a small uptick so far, and the fed has confirmed that more are on the cards. Currently, we see little impact on our clients’ interest in making acquisitions, but it could potentially come later.
Russia/Ukraine Conflict
At the time of writing, there is some progress being made in peace talks, but the actual outcome of the conflict is very unclear. Not only with Eastern European deals, but this impact will also impact deals across the globe, For instance, rising oil prices exacerbated by the war can impact a US manufacturer with no operations in Ukraine.
Impact of the Rising Price of RWI
So far, we have not seen rising premium prices deter our clients from using RWI. A point comes where RWI does not make sense, and we came close to that at the end of last year. However, the current 4.5–5.5% (while not the heady days of 2.5–3%) still make it a better mousetrap than standard escrow which will always be less attractive to sellers and does not offer the same protections to the buyer as RWI
Regulation
The global regulatory environment became more pertinent to dealmakers in 2021, and we expect it will continue to receive increased attention. Regulators in the US and around the world have made it clear in action and in statements that the increased scrutiny and oversight will continue.
SPACs
While historically SPACs have been variable in their use of RWI, the increasing litigation makes RWI more attractive from a defense perspective. The most often cited accusations in SPAC litigation relate to how much diligence the buyer did, what the buyer knew, when they knew it, and how it was communicated. The process of putting RWI insurance in place provides a readymade, clear, independent paper trail outlining who knew what and when and proving that rigorous diligence was done.
The Increased Use of RWI in Secondaries
While this is only offered by a limited group of underwriters, now it is certainly a valuable addition to the toolbox for the secondary seller and buyer. If the rate of usage continues to grow, this will lead to an increase in submissions which would invariably lead to a greater number of underwriters jumping on the bandwagon. More underwriters mean better, more competitive pricing for RWI buyers.
RWI Competition is Up, and Pricing is Down
We looked at several metrics to compare data between this same time last (2021) and how the first quarter of 2022 is shaping up. We also compared this data to the last quarter 2021 (October–December). The data shows us RWI market competition is up, and pricing is coming down. The very high pricing of the last quarter of 2021 is over. We expect to see the market continue to settle.
How far pricing may go down depends on a very large and complex system comprising the local underwriter market, global economy, and M&A activity.
We will continue to keep you updated as the situation evolves.
Author

Table of Contents