

Blog
RWI Premium Rates: Is the Rise Here to Stay?
 Emily Maier
 Jan 27, 2021

There is not much to say about 2020 that hasn't already been said. In the RWI world, we have seen more ups and downs in premium rate and deal flow than in previous years for a variety of reasons.

We had the low deal flow of the second quarter while everyone waited to see how things would unfold. We saw higher-than-average third- and fourth-quarter activity once the new "normal" of the M&A world was established. We also witnessed premium volatility as underwriting markets came to grips with the possible costs of COVID-19, not just in the M&A space but in the underwriting market as a whole.
We thought it would be interesting to dive in and explore how premium rates fluctuated in 2020, then examine where we think rates will go from the start of this new year.
Methodology for Assessing RWI Premium Rates
To avoid providing outliers, we have not included outsize deals in the following graph. In this context, we have categorized "outsize" as limits over $200 million or deals over $2 billion.
With a deal requiring over $50 million in limits, we usually employ what is commonly referred to as a "tower." What this means is that we build the coverage in layers, with the bottom layer being the "burn" layer, or the layer most likely to be hit in the event of a claim. The higher layers are sitting "above," and the chance of a $50 million loss is greater than the chance of a $100 million loss, so the underwriter taking the risk of the $50 million above the primary $50 million gets the lesser rate.
In RWI, the usual factor between layers is 75-80%, which will yield something like this:
| LIMIT | UNDERLYING LIMIT | ROL | PREMIUM |
| Primary $50M | $2M retention | 4% | $2,000,000 |
| Second $50M | $52M | 3% | $1,500,000 |
| Third $50M | $102M | 2.25% | $1,125,000 |
| Fourth $50M | $152M | 1.6% | $800,000 |
| Total | $200M xs $2M | 2.7% |
The ability to build large towers not only allows us to smooth rates, but also gives us outliers. As we discussed, the primary—above the bottom of the tower—is considered more likely to be hit. In addition, it is usually a larger single limit that is at risk. This common wisdom is that the chance of getting a limited loss of a $2 million claim on a $20 million deal is lower than the chance of getting hit with a limit loss on the first $50 million layer of a $2 billion deal.
At the top of the tower, the chance is much lower, and you are able to put a larger slice of capital to work where you get a much smaller rate.
If we threw those numbers into our calculations, we would have to present much lower lows and much higher highs, which makes it harder to see what is happening in the middle market.
We have also kept very small deals out of the analysis, by which we mean anything under $50 million, as those often have limits around minimum premium, and thus can have larger rates from a percentage perspective. We have kept our analysis to the mid-market, with a deal size between $50 million and $1 billion.
Analysis of RWI Premium Rates
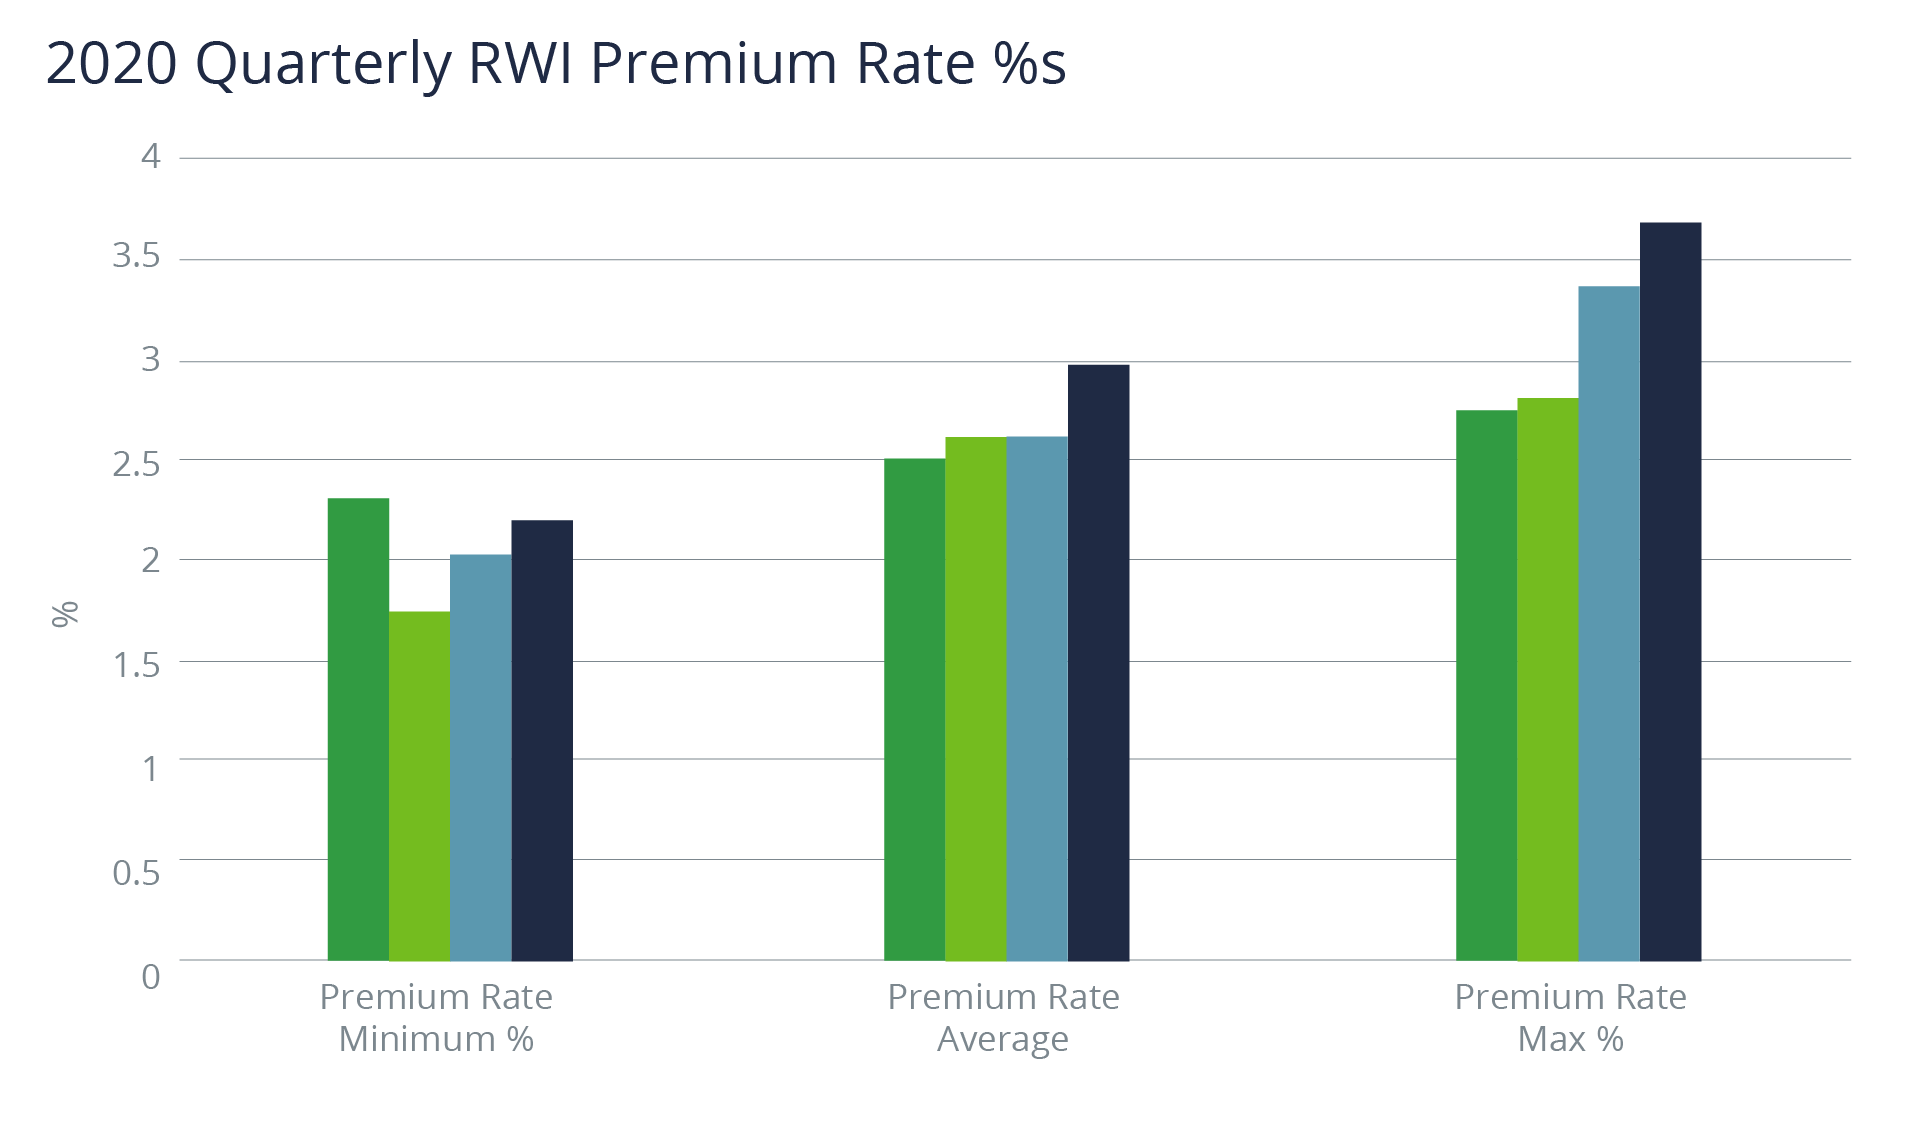
As you can see from the following graph, 2020 started off bullish. The minimum rate was 2.3%, and the average 2.4%, with the highest prices being 2.7%—a pretty tight range, and very consistent with what transpired the previous year.
The second quarter was a total anomaly. Deal flow slowed to practically zero for a period, and any deals that were still alive were moving slowly. Those that did place were either unusually popular due to the lack of activity, which is where we saw 1.7% rates, or had a bit of hair on them, leading us to slightly larger averages and slightly higher max premiums.
By the third quarter, the flow had pretty much returned to normal, or was possibly even stronger than the first quarter as a result of many deals that had been put on hold coming back into the market. We saw the minimum rate inch back to pre-COVID rates. We also saw the average remain the same but begin to edge upward at the top end of the range. This bump was partly a result of several markets swapping all-encompassing COVID exclusions with very minimal COVID exclusions in exchange for higher pricing. Many of our clients were more than willing to pay for that extra coverage during what was still a fairly uncertain time.
Underlying the aforementioned bump, we saw the normal pricing mechanism of supply and demand. Every deal has a potential opportunity cost to an underwriter, and the standard price response to demand outstripping supply began to come into play.
The fourth quarter was when things started to get really busy. The usual year-end push that we normally see was materially higher, and people were pushing hard to get deals in before year end. Brokers and underwriters were working at max capacity, thus supply and demand led to substantial price hikes, which we can clearly see in the graph below.
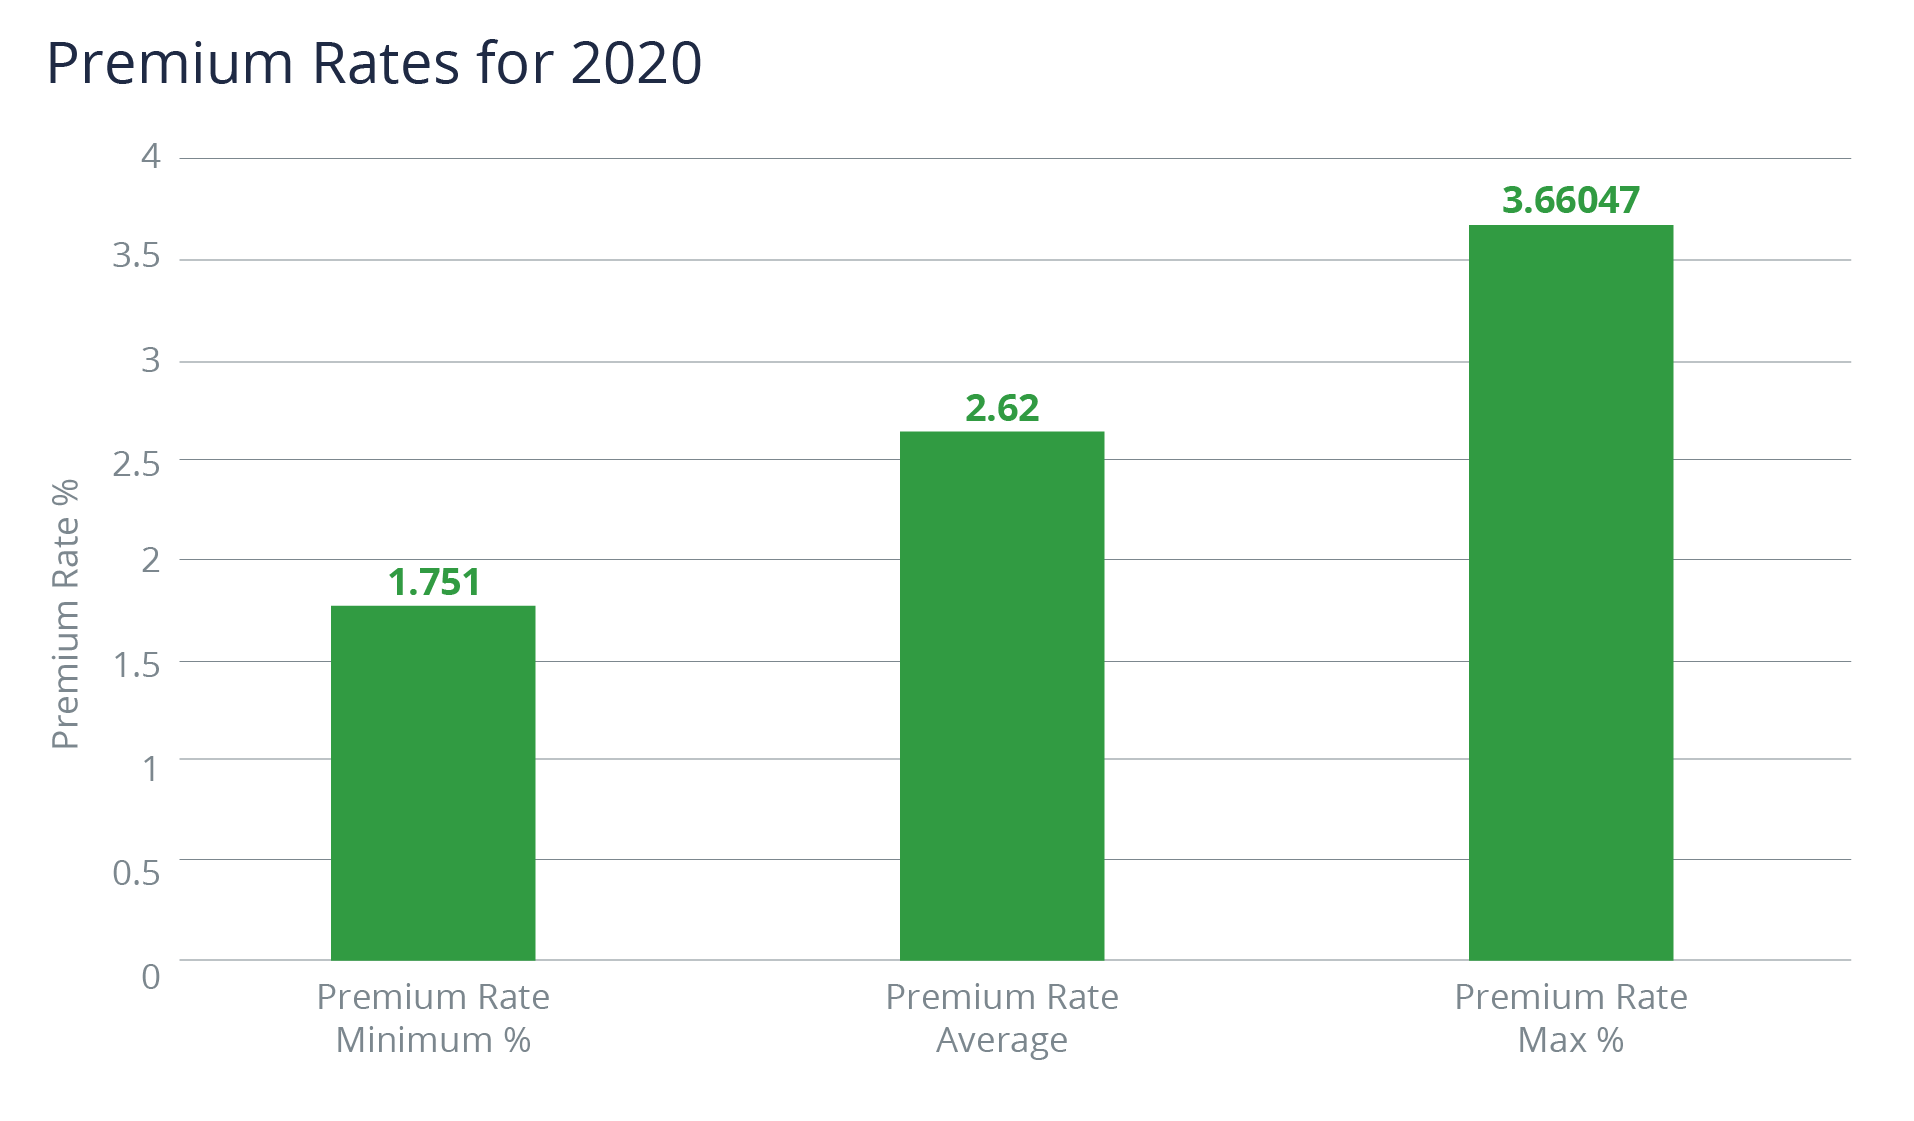
At a simpler level, if we look at premium-rate range across the whole year, we can see the wide variety of pricing. Your $10 million of coverage might cost you $170,000, or it might cost you $366,000. Once we get to the $50 million limit, we are talking about deltas of around a million dollars.
What's Next for Written Premium and Capital?
So, new year, new capacity. Underwriters have new goals to hit in terms of written premium and a fresh amount of capital with which to underwrite.
It's early in the year, but we are already observing some trends. January is usually a quiet time, but not in 2021. We are seeing deal flow still unseasonably high and a market not yet sure of its response.
On risks we are sending to market, we are seeing a wide margin of pricing options come back. Minimum rates are 2.2%, while maximum rates are 4%. Sometimes we see that big of a range of pricing on a single deal.
In terms of deals being done, we have observed that they still trend toward the COVID "winners": video games, gardening supply and home improvement, telemedicine, online media, online services, and the usual constant run of SaaS and tech deals.
We believe the market will continue to settle as 2021 progresses. Currently, our average premium rates are around 3.5% rather than the 2.5% of old. We expect to see this continue into the first quarter but hopefully return to pre-COVID rates by the second quarter.
Author

Table of Contents