

Blog
Track Your Wildfire Risk with Mapping
 Jul 15, 2021

Tracking your wildfire risk is a critical step in preparing for and responding to a wildfire.
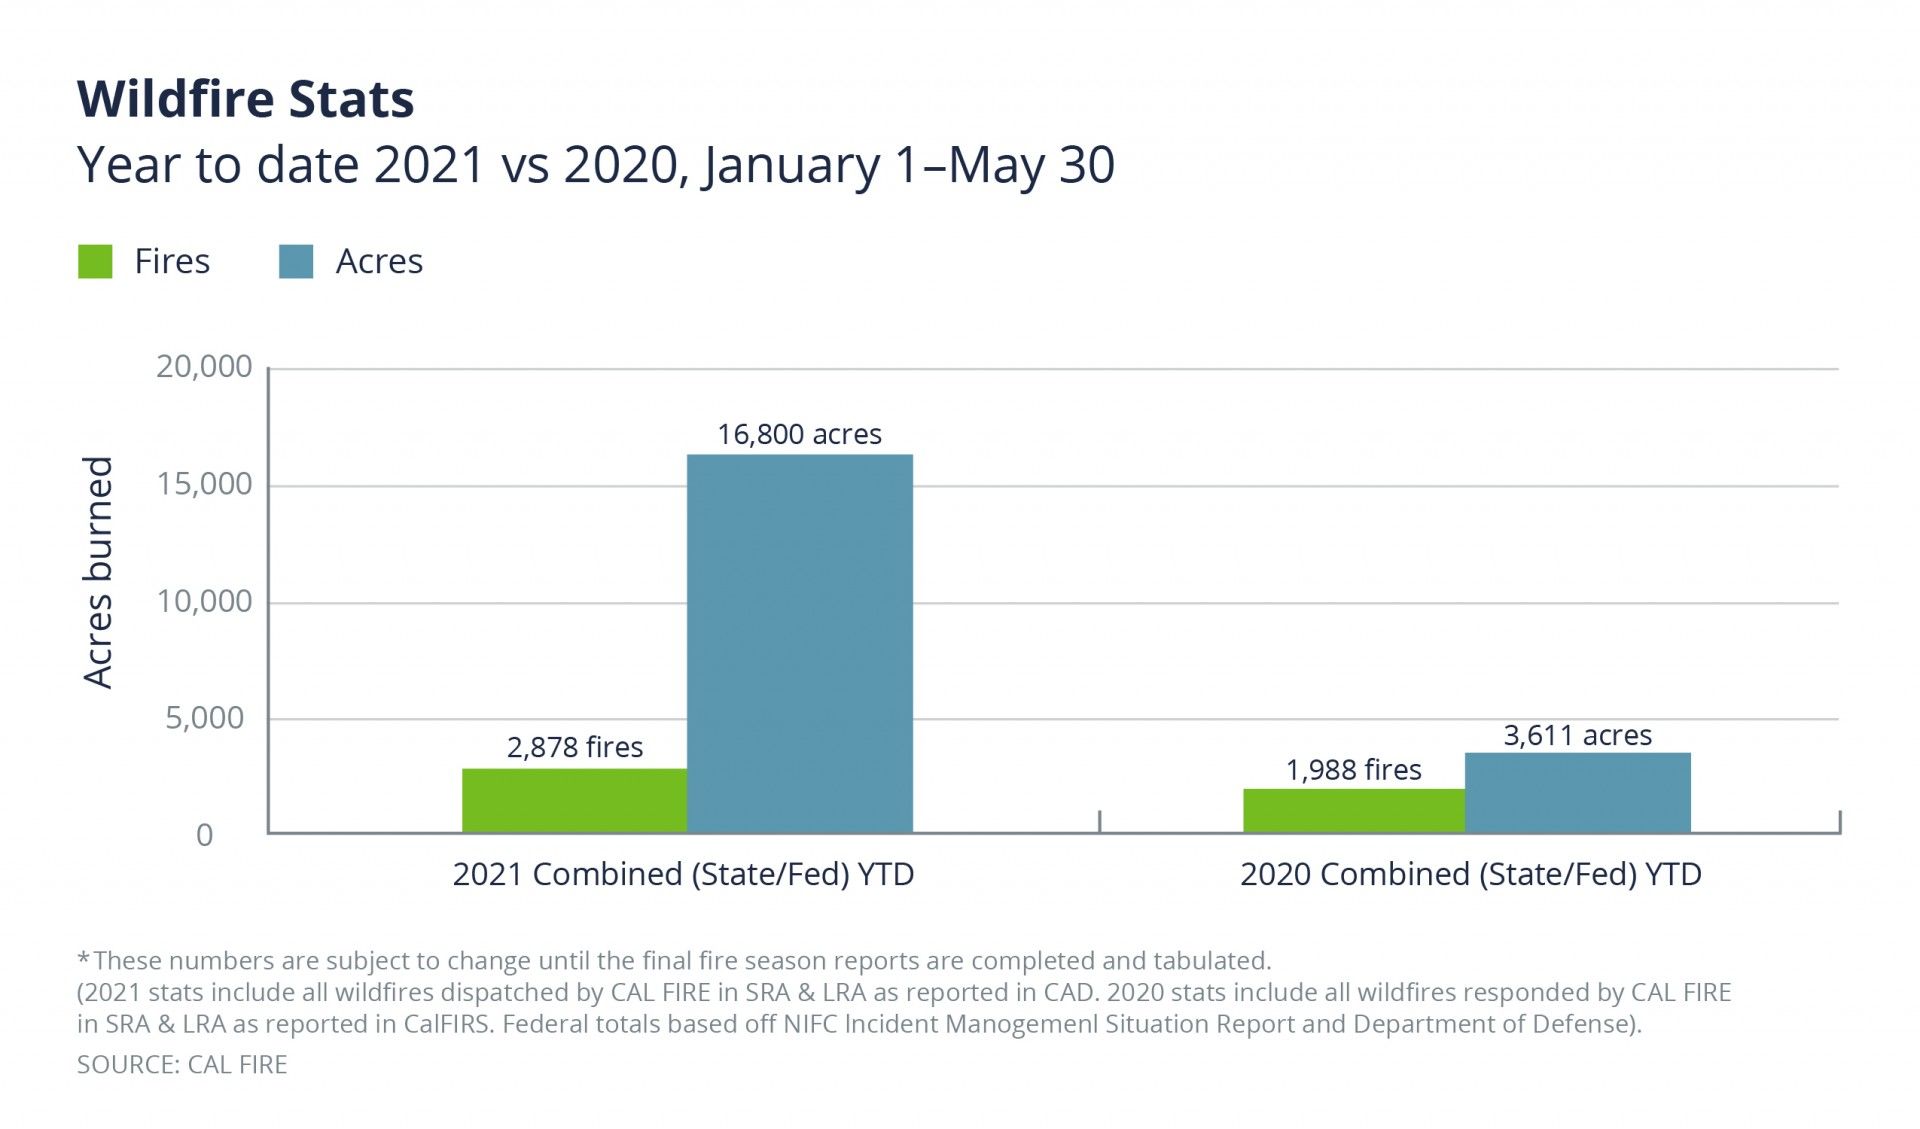
With worsening drought conditions across the West, the 2021 fire season is already off to an ominous start. Although the first half of the year is not part of wildfire season, California had 890 more fires from January 1st through May 30th this year than the same period in 2020.
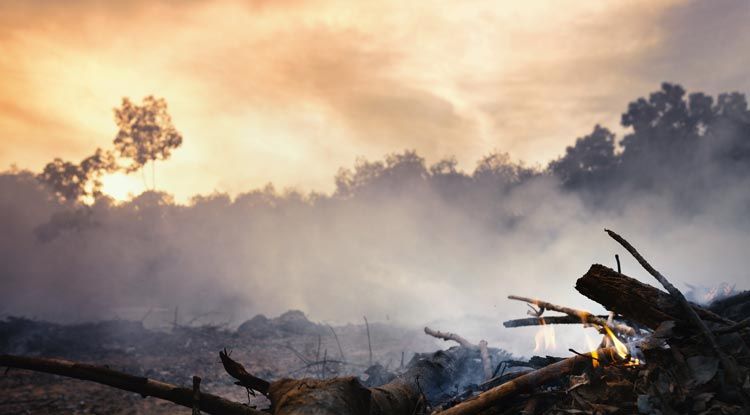
Soaring temperatures, parched vegetation, and strong winds will continue to increase the danger of wildfires as summer wears on. Tracking your wildfire risk is a critical step in preparing for and responding to a wildfire.
In a previous article, we explained how to identify your wildfire risk and the steps you can take to reduce the danger to your property. This article will share wildfire mapping and modeling resources to help you stay on top of any emerging threat.
An established wildfire emergency response plan can put your business above the average client in terms of risk. Woodruff Sawyer clients who establish, develop, and update emergency response plans on a regular basis are seen favorably by Underwriting Markets worldwide.
How to Use Wildfire Mapping to Mitigate Risk
In recent years, wildfires have become more widespread and damaging to cities and communities, costing billions of dollars in losses every year. Since 2005, wildfires have destroyed more than 89,000 structures and threatened around 2,000 communities in the US.
After the news cameras have moved on, the long-term impacts of these disasters remain. Nearly half of the recovery and restoration costs are borne by cities, counties, small businesses, and homeowners.
When used in conjunction with a properly established wildfire emergency response plan, wildfire mapping is an effective tool to help keep your employees and property safe. Although predicting the behavior of wildfires is not an exact science—many factors, including wind, come into play—it is possible to track the progression of fires with sophisticated satellite imagery that is available online.
For example, the US Forest Service introduced Wildfire Risk to Communities last year. The free website offers interactive maps and charts to help you evaluate risk and provides tips to help communities manage and reduce risk. While this new resource is designed for local officials, it offers useful information for homeowners and business owners.
We’ll share some other resources below, but first, here are some key steps for using wildfire mapping resources to their best advantage.
- Monitor maps and resources frequently. Wildfire mapping should be monitored daily with reports to management and response teams if a wildfire is burning within 75 miles of your property.
- Since fire behavior is subject to many variables—especially wind—more frequent reviews may be necessary. Review MODIS and VIIRS satellite wildfire mapping data layers within the mapping resource to ensure the most accurate information.
- During the late spring and summer, monitor dangerous fire conditions by using the NOAA Fire Weather mapping resources.
- Pay close attention to local weather forecasts on the TV, radio, and internet, and make it a point to follow wildfire signage. Signs showing fire danger levels from “High to Extreme” indicate a need to actively monitor fire weather conditions in your area. Monitoring emergency channels for fire weather updates is also key.
A Brief History of Wildfire Mapping and Modeling
The history of wildfire modeling and mapping follows the US Forest Service, which has been part of the US Department of Agriculture (USDA) since 1905, and its “war on fire.”
Before computers, experts like Wallace Fons forecasted fire growth using physical maps, spread rate calculations, and vectors of slope and wind effects. Light aircraft were used for wildfire mapping purposes before the use of satellites to monitor wildfire activity.
It was not until 1980 that National Oceanic and Atmospheric Administration (NOAA) weather satellites observed the first wildfire from space using Advanced Very High-Resolution Radiometer (AVHRR) instrumentation. A mathematical method was soon developed for satellites to distinguish small fires from other sources of heat. This method formed the basis for nearly all satellite fire-detection algorithms that followed.
NASA launched its Moderate Resolution Imaging Spectroradiometer (MODIS) in 1999 and a second MODIS instrument in 2002. After 20 years in orbit, the optical and thermal bands on MODIS, which can detect both reflected and radiated energy, continue to offer daytime and nighttime visible imagery and information on active fires.
From space, MODIS and Visible Infrared Imaging Radiometer Suite (VIIRS) sensors remain the standard of modern satellite wildfire detection and observation. Unlike MODIS, the VIIRS imager band has a higher spatial resolution that allows the detection of smaller, less intense fires. VIIRS has a Day-Night Band that can measure low-intensity light emitted at night and by small or early-stage fires.
Scientists access remote sensing data on wildfires in many different ways. NASA’s Fire Information for Resource Management System (FIRMS) uses MODIS and VIIRS data to provide updates on active fires throughout the world, including a rough location of a detected hotspot. Imagery is available within four to five hours.
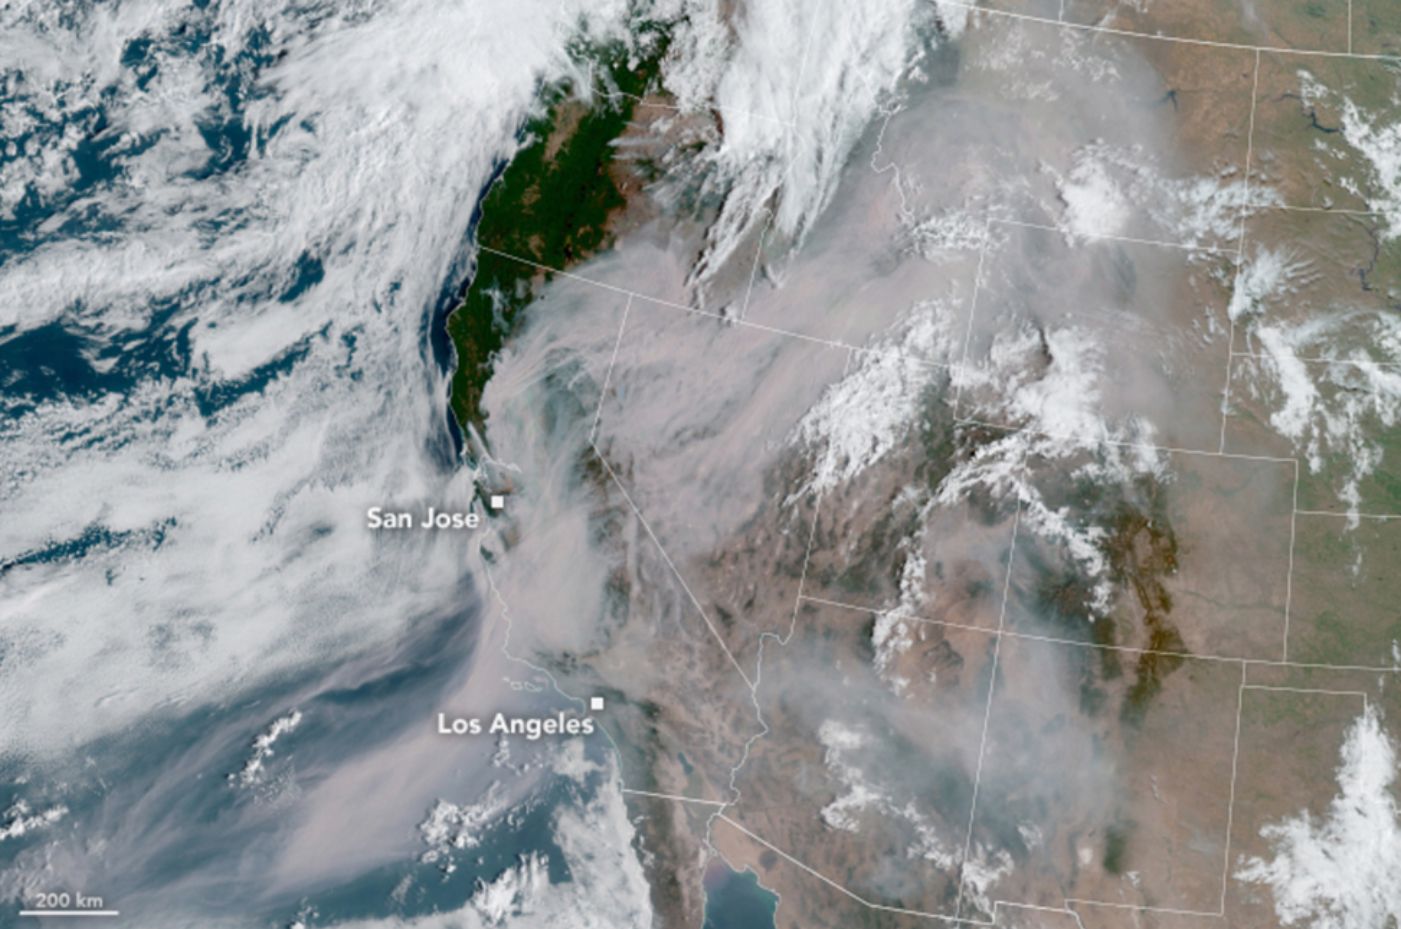 GOES Image of California Wildfire Smoke – August 20, 2020
Courtesy: NASA.GOV[/caption]
US Wildfire Mapping Resources
The National Interagency Fire Center (NIFC) is the primary command agency for wildfire mapping and resources. Headquartered in Boise, Idaho, the NIFC coordinates responses to many different emergencies, but its primary focus is fighting wildland fires.
The eight agencies that are part of the NIFC share firefighting supplies, equipment, and personnel. In the event a fire situation escalates, the NIFC activates the National Multi-Agency Coordinating Group to set priorities for obtaining whatever is critically needed to fight the fire.
[caption id="attachment_25637" align="alignnone" width="1206"]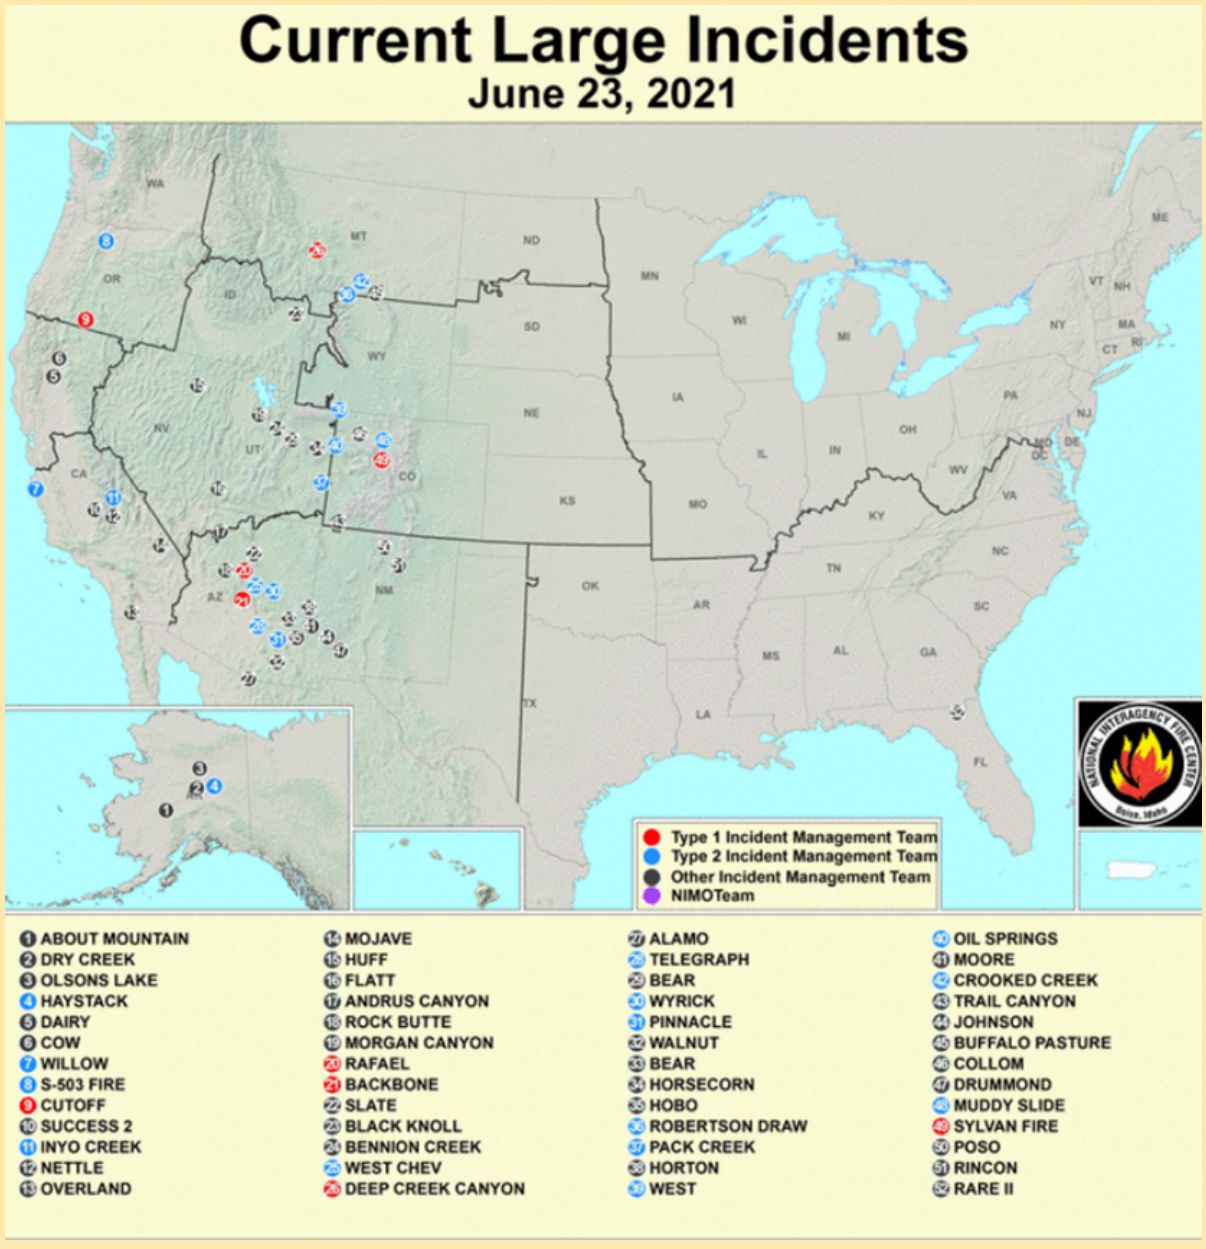 National Interagency Fire Mapping – Retrieved June 23, 2021[/caption]
Canadian Wildfire Mapping Resources
Canadian Mapping Resources includes the Canadian Wildland Fire Information System (CWFIS). The CWFIS includes updated fire forecasting presented in clickable map layers.
European and Worldwide Wildfire Mapping Resources
European and other worldwide mapping resources typically rely on satellite imagery or local agency reporting. In developed nations, this could include real-time observations and reporting. In developing nations, this is limited to satellite data. The Copernicus Emergency Management System utilizes the MODIS and VIIRS satellite imagery. Consequently, Copernicus may be used for Worldwide Wildfire Mapping.
Additional Mapping Resources
The threat of wildfire touches all portions of the globe. Below are additional wildfire resources:
Fire and Smoke Map (airnow.gov) shows air quality layers in addition to wildfire incident mapping
ArcGIS - US Wildfire Activity Web Map shows detailed wildfire incident mapping
Active Fire Data | Earthdata (nasa.gov) shows current global wildfires
Geospatial Multi-Agency Coordination (GeoMAC) was a government mapping/data archiving application that was used until May 2020 for archival of historical fire map data. Historical Wildfire GIS Data for wildfire from GeoMAC can be found here. The information is now serviced and maintained here through the NIFC.
If you have experienced property loss due to wildfire, please visit our Wildfire and Loss Control page for information on how to report the loss and guidance on reviewing your insurance coverage including wildfire mitigation, evacuation tips, claims reporting, and a roadmap to recovery.
Table of Contents