
Blog
Public D&O Insurance Pricing Trends: What Happened in 2022, Why, and Implications for 2023
 Jul 19, 2023

In this blog, we examine market events since that have contributed to creating 2022’s buyer-friendly D&O insurance market.
"What’s going on with D&O rates” is the question I am asked the most these days. “Things have gotten better” is my quick—and welcome—response. In this week’s D&O Notebook, Woodruff Sawyer Partner Munish Arora provides the detail and dynamics that explain the D&O insurance rate environment. – Priya
|
In Brief:
|
During the latter half of 2022, D&O insurance rates declined significantly for many of our clients. The reduction in D&O pricing for small and mid-size companies was more significant than expected despite the systemic uncertainty due to the Russia-Ukraine War and increased inflation that lowered the market caps across the public companies in the United States.
In addition to experiencing a reduction in their insurance cost, about 40% of our clients were also able to reduce their self-insured retentions.
How did we get here? A combination of recent systemic factors and the harder insurance markets during 2018–2020 have created the current soft insurance market.
In this article, we’ll go down memory lane to explore and understand why we are now seeing a buyer-friendly D&O insurance rate environment.
D&O Litigation Landscape (2018–2020)
The United States Supreme Court ruling in Cyan, Inc. v. Beaver County Employees Retirement Fund in March 2018 cleared the way for shareholder plaintiffs to bring Section 11 suits in all state courts. As a reminder, until Cyan, there was a split in the federal courts regarding whether cases brought under Section 11 of the Securities Act of 1933 could be brought exclusively in federal or also in state courts. The consequence of the Cyan ruling was duplicative filings in state courts, multi-jurisdiction litigation, and forum shopping. In 2019, section 11 cases doubled, from an average of 40 cases a year to 80+ cases (See Figure 1).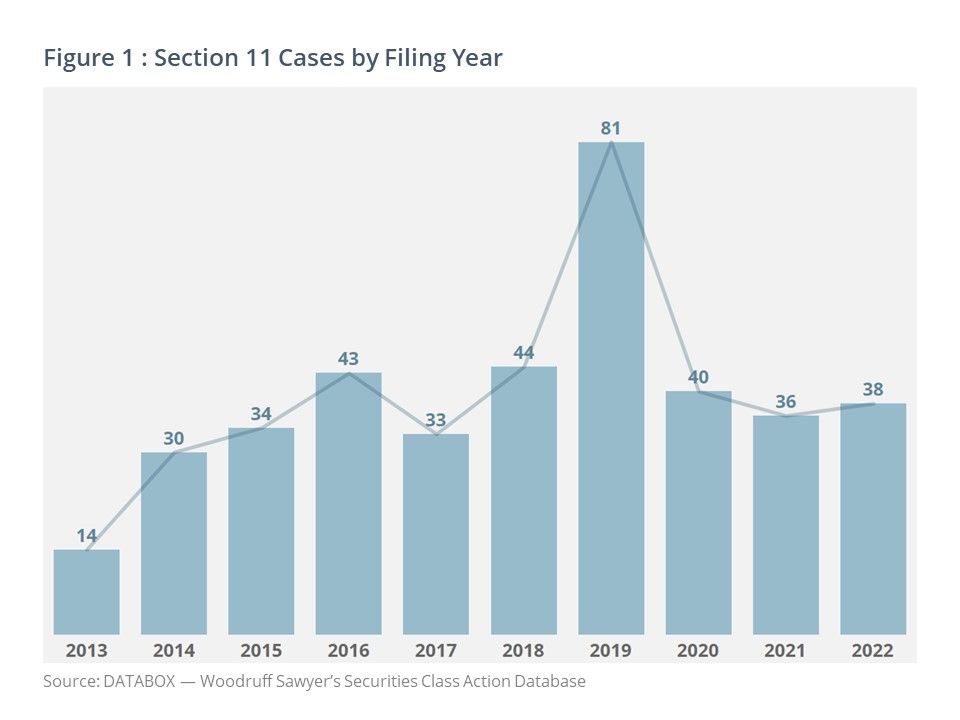 Insurance carriers responded to this ruling with three adverse market trends:
- Increased self-insured retentions
- Reduced insurance capacity
- Increased rates for primary and excess layers
These dynamics were so severe that companies looked for innovative ways to avoid Section 11 suits. They found a way by using federal choice of forum provisions, which in 2020 were found to comport with Delaware corporate law in the unanimous Delaware Supreme Court ruling in Salzberg v. Sciabacucchi. California and other state courts swiftly granted motions to dismiss Section 11 claims brought in state court on the basis of federal forum provisions. The ruling was considered a significant win, and it was certainly a relief to D&O insurance carriers.
| Note: Section 11 suits allege liability for material misstatements and omissions in registration statements, such as S-1 registration statements used for IPOs. Issuers, as well as officers and directors of the issuers, are typically named as defendants in these cases. |
Increased IPO Filings (2018–2021)
Even as high premium rates created a challenging D&O insurance market for buyers, the IPO and SPAC market was picking up the pace.
Between 2018 and 2019, annual IPO filings in the United States were 230–260. In 2020, while most of us were spending quality time with our families and wondering about the uncertainties due to the COVID-19 pandemic shutdown, the IPO market saw 480 filings, nearly double of the prior two years. In 2021, IPO filings broke records with 1,035 total filings, including many SPAC IPOs, according to Statista. (See Figure 2.)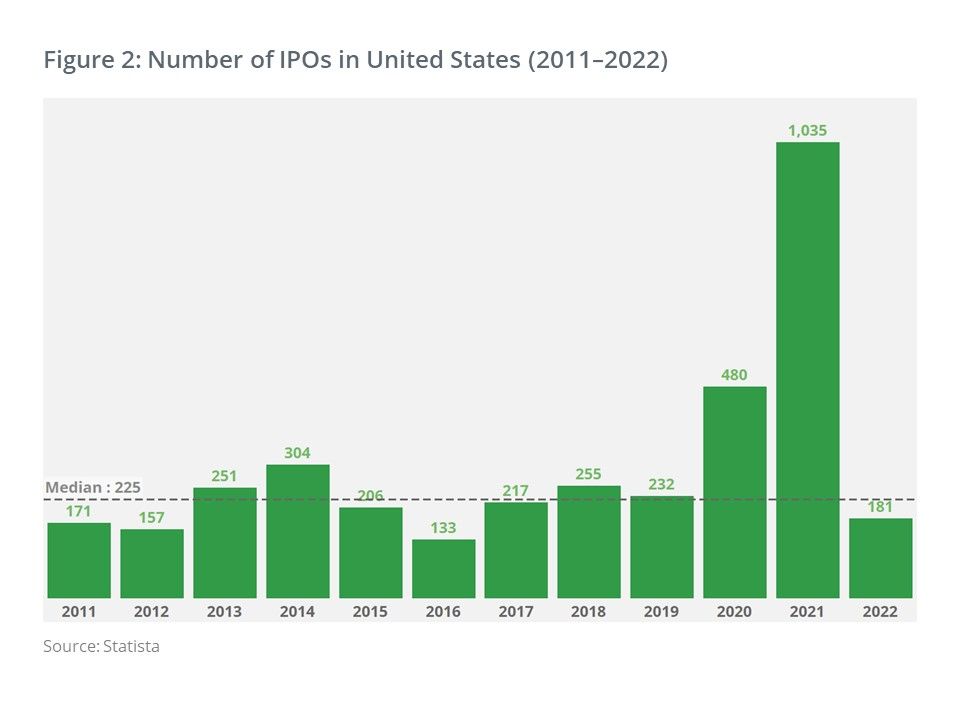 What followed was economics 101: The already hard market (with reduced carrier capacity and increased rates), additional demand for public D&O insurance from new public companies, and poor loss ratio results for a few carriers in prior years pushed the price of D&O insurance to its record high in 2021.
The increasing rates during 2019 and 2020 replenished D&O reserves. This was reinforced during 2021, when D&O insurance demand peaked for new IPO filings. In a study published by S&P Global in 2021, the US D&O insurance market recorded $4.1 billion in direct written premiums in Q3 2021, compared to $2.97 billion just a year prior. That's a 38% year-over-year increase.
This rapid rate increase and higher demand brought new carrier interest into the D&O market. In addition, existing carriers opened their capacity and responded with better rates for better risks. In Figure 3, we show an engineered market rate pricing index1. The index shows that relative to Q1 2018, the market rates for our median client rose to 4.7x, then dropped to 3.3x by the end of Q4 2022. 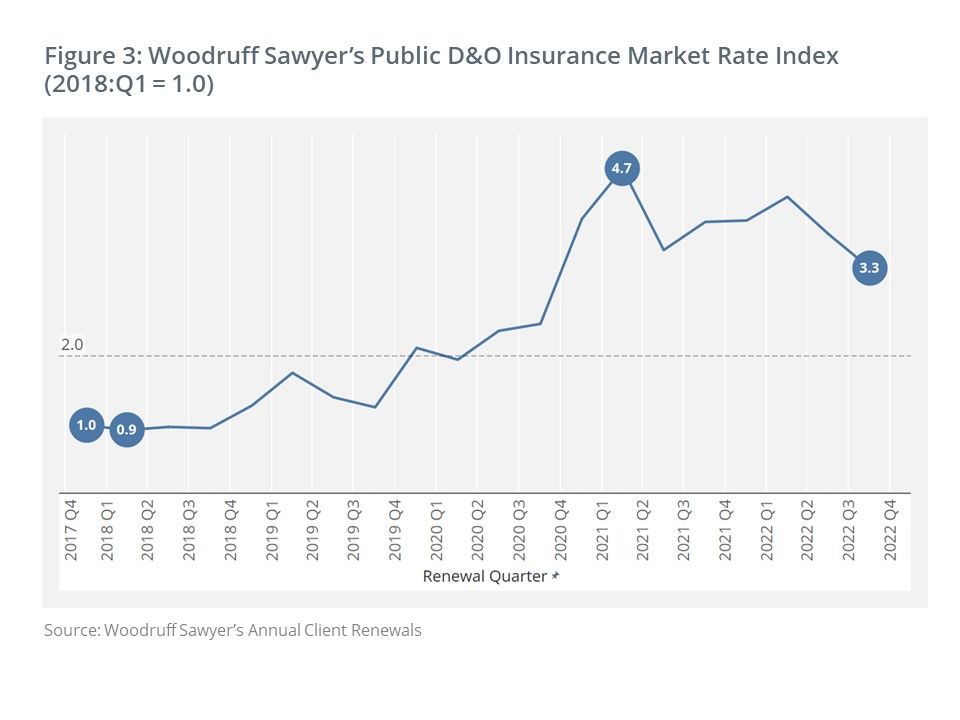
Rate Behavior of Mature D&O Client Segments
Mature mid- and large-size companies experienced the pain of rate increases during 2018–2021, but their rate increases were lower than those of less mature public companies. Figure 4 shows our public D&O market rate index for mature companies, indicating that median clients in this business segment saw pricing peak at 2.3x relative to Q1 2018 rates (versus a peak of 4.7x for all public companies). In addition, we think the impact of systemic factors (discussed in the next section) was so profound on this segment of our business that insurance carriers could not deliver rate reductions at similar levels as they did for young companies.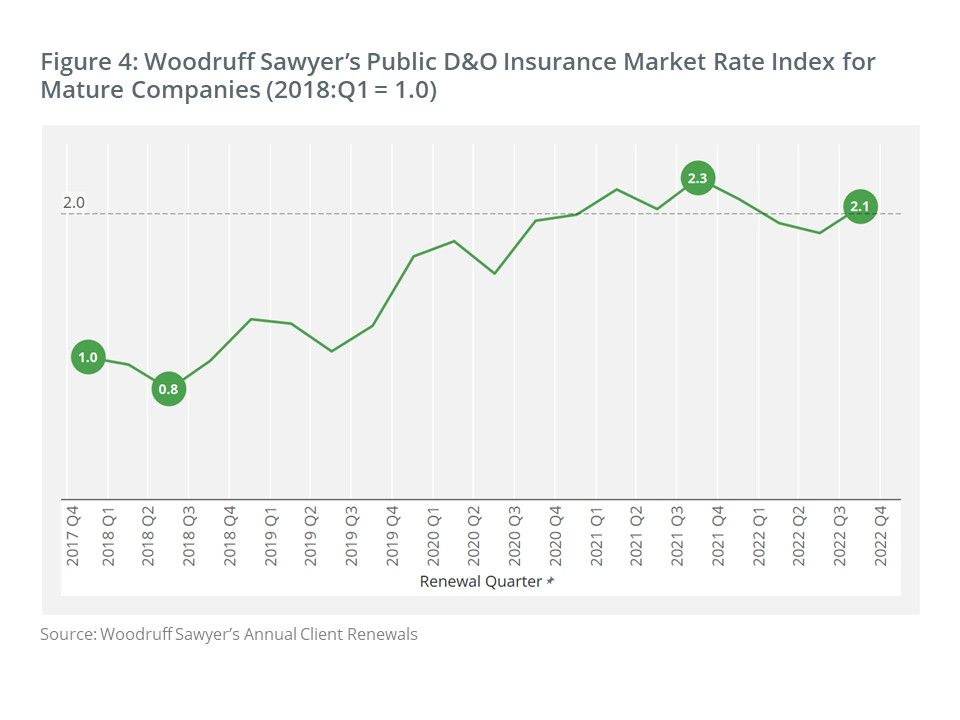 One last thing: These results for median clients indicate a directional change in market rates. For individual clients—especially large ones—the risk attributes are often unique and can swing these trends in either direction. Discuss with your account manager the reasons why you may have seen changes different from a median customer.
2022: Company Valuations Decrease, Insurance Demand Shrinks
Of course, the IPO party could not go on forever. In 2022, we saw two systemic factors that impacted company valuations: Interest rates and Russia’s attack on Ukraine.
First, the federal government had been signaling for a long time that it would start raising interest rates. The job market bounced back as COVID rates and measures evolved. Historically low unemployment rates, increased capital markets activity (including IPO activity), and high valuations for companies supported the fed's decision to increase rates.
Second, at the beginning of 2022, we also saw Russia's attack on Ukraine, further creating uncertainty for the equity markets. As always, an increase in risk and uncertainty negatively impacted company valuations.
Several other factors also affected valuations, including:
- In Q4 2021, when nearly the entire country had resumed business as normal, the inflated revenue and growth speculations that characterized the market for some firms during the extended shutdown started vanishing.
- After two years of operating results, many new IPO companies moved their valuations into "realistic" territory.
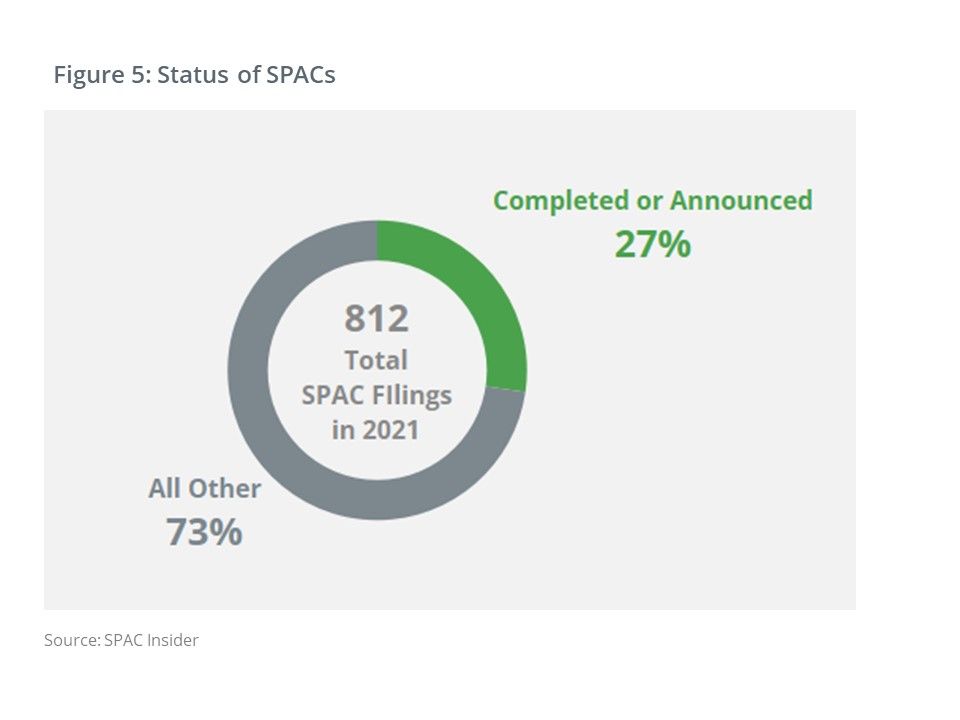
- The SPAC boom ended as their two-year search limits started expiring in 2022. Of the 812 SPAC filings in 2021, only 27.3% SPACs have announced or completed a transaction. About 73% are searching, liquidated, withdrawn, or abandoned, according to SPAC Insider (See Figure 5).
The result of all of these factors was severely declining valuations in equity markets during the first half of 2022 that worsened by the end of 2022. Thus, while carriers had a fantastic year in 2021, in 2022, the demand for D&O insurance started shrinking and was lower than the available capacity. Result? Since July 2022, we have been seeing lower rates and reduced self-insured retentions.
Woodruff Sawyer Clients in 2022
What is the recent state of the market for the Woodruff Sawyer client deals? Here are some key statistics:
- Half of our clients saw 20% or more savings in their year-over-year cost of insurance in the second half of 2022.
- Recent IPO clients with no claims enjoyed even higher year-over-year cost savings.
- For our public D&O clients, 40% reduced their retention and saved on their insurance cost.
- Our life science and biotech clients had 10%–20% higher savings than other sectors.
- The savings were mostly seen by relatively younger, small-cap and mid-cap companies.
- Larger companies did not see as severe rate increases as small- and mid-cap companies during the peak rate environment. The more recent cost savings for larger clients have been in the range of 5%–15% during the second half of 2022.
- Most of our clients did not change their insurance limits.
What About 2023?
First things first: If you're not seeing savings in the cost of your D&O insurance, contact our D&O insurance specialists to explore possible options.
Second, remember that insurance risk management is an inherently cyclical business—the uncertainty in the frequency and severity of losses creates hard and soft market cycles. Don't forget that the systemic unpredictability due to the macro socio-political environment can further impact those cycles. When the rate environment is soft, carriers often experience a poor loss ratio (i.e., carriers pay out more in claims than they earn in premiums). This experience will swing rates back towards an upward trajectory.
Finally, consider the velocity of the cycle. Modern D&O insurance markets respond much faster than they did 10–15 years ago, as established by the Cyan decision, increased IPO filings, and SPAC activity. CEOs, CFOs, general counsels, and board members will want to work with their trusted D&O insurance advisors to strategize how to build a stable insurance risk management program that effectively takes into consideration the company’s financial goals and risk tolerance.
Table of Contents