

Blog
Reps and Warranties Market Trends: A Look At 2017 And What To Expect In 2018
 Tyson Freeburg
 Jun 19, 2018

With the release of AIG’s third annual claims report, we thought it useful to give a quick recap and highlight some trends we are seeing in the world of representations & warranties insurance (RWI). Special thanks to AIG for providing an invaluable resource of information we can use to take a proactive stance against the risks our clients face throughout the acquisition process.
Market Trends Impacting Reps and Warranties Insurance
RWI has been proven to serve as an effective deal facilitation tool. With unprecedented dry powder levels, and a change to tax regulations, it’s not surprising that we have experienced an increase in the number of deals where parties require RWI to protect their investments post-close.
Claims Filings
More use means more claims. As such, continued use by sophisticated insureds has resulted in a rise in claims filings. According to AIG’s report, nearly one in five RWI policies received a claim notification. The good news is that premiums remain low, claims get paid, and insurers are continuing to offer broad terms & conditions within the policies.
Hiring
Underwriters are in demand. This limit on bandwidth makes it more challenging to place smaller and/or very complex mid-size risk. Nearly all underwriting teams are looking to hire more people.
Timeline Constraints
Another trend we are seeing is timeline constraints. In an attempt to get ahead of competitive market conditions, dealmakers are moving quickly at potential opportunities. We do not see this as a negative or positive since the RWI underwriting process is designed for speed and flexibility. However, it is worth noting that hiccups do occur during the underwriting phase and, in case you have lost track of the copious notes you took while reading my last blog, it’s a good idea to get your RWI broker involved early in the process to avoid unwanted delays.
Frequency
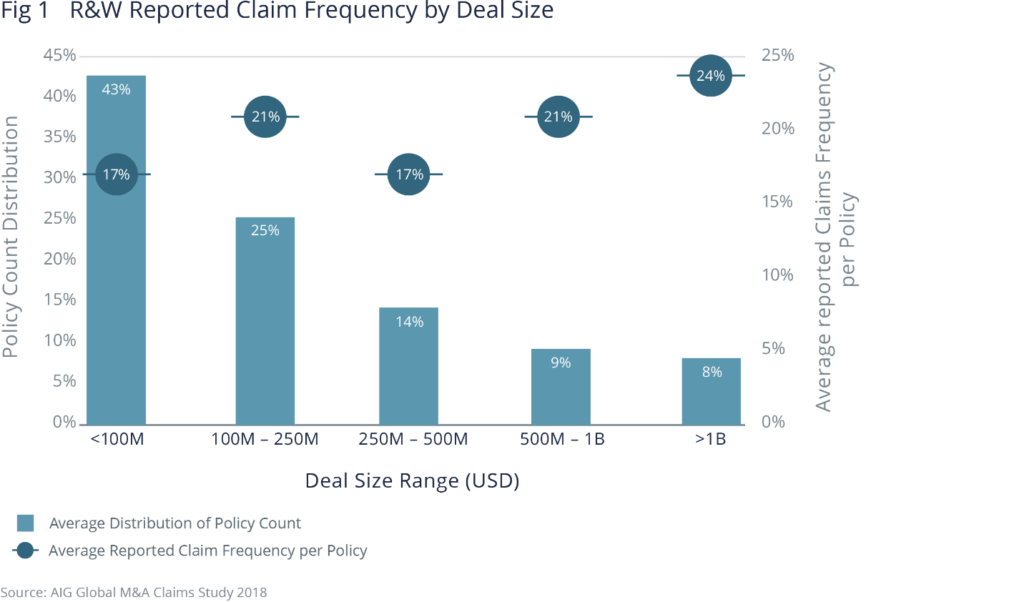
As previously mentioned, nearly one in five RWI policies receive a claims notification. Claims frequency has continued on an upward trend for mid to large sized deals. For example, 24% of deals with an enterprise value over $1bn received a claim notification, compared with 17% of deals with an enterprise value under $100m. Claims for deals with an enterprise value between $500m and $1bn has increased from 18% to 21% since the last report.
The ability to diligence every aspect of a larger deal is a challenge. Additionally, even a small error can lead to a big loss from a dollar amount perspective, so the correlation between claims frequency and size of the deal should come as no surprise. With deals at the smaller end of the spectrum, we see a lower frequency (17%). In these situations, the reverse is true. A mistake could be material but its dollar impact might not be.
Severity
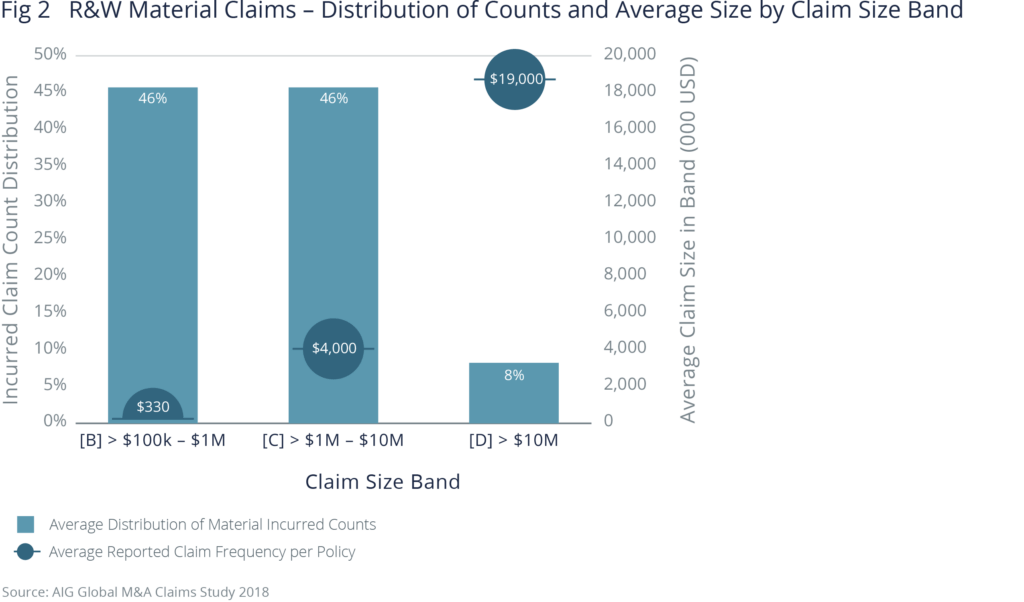
While frequency of claims has increased on larger deals, the average severity of claims over $10m has decreased to $19m from $22m the year prior (Click here to view AIG 2017 Claims Report). The severity of smaller claims has, however, increased along with frequency. This tells us that clients and brokers should be conscientious when selecting a limit of coverage as material claims on larger deals can be costly.
Timeline
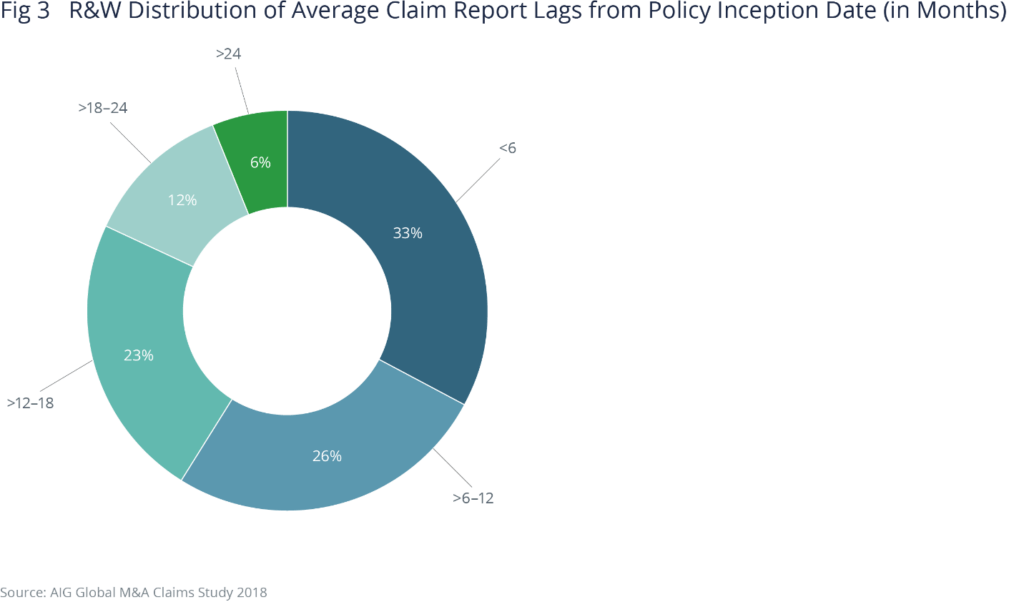
The first two years of a policy are considered the most risky. First audits are often a time of discovery. Claims notifications are also being filed in a timelier manner. A year ago, 27% of claims were filed within the first 6 months after closing. According to the 2018 report, 33% of claims are now being filed during the same period. More importantly, 82% of claims are filed within 18 months after closing, which is equal to the indemnity escrow period on the vast majority of M&A deals. 59% of claims are received within one year of closing.
Breach Type (Global Total)
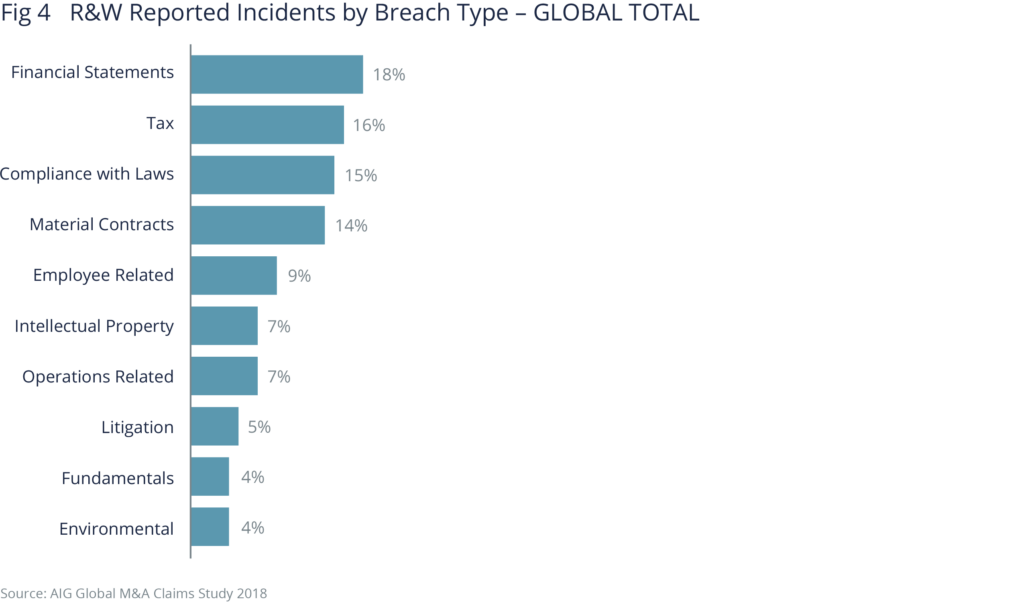
Financial statements continue to be the biggest driver of claims, followed closely by tax, compliance with laws, and material contracts. This is not surprising as many breaches in one area can potentially be a breach under financial reps as well.
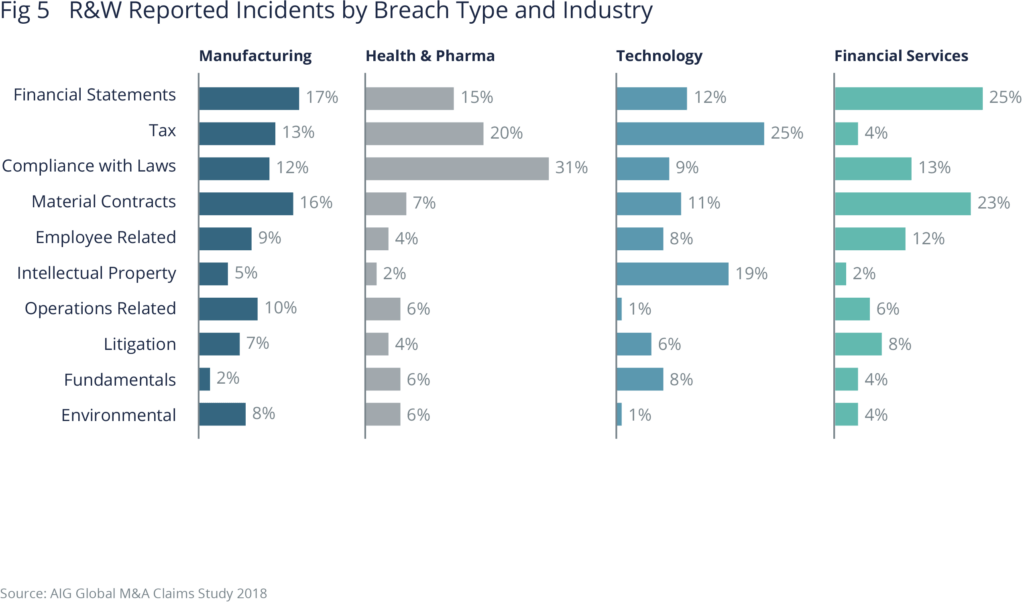
Breach Type by Industry Sector
In the 2018 report, AIG has broken down claims statistics by industry sector. There are not a lot of surprises on this list. Financial statements are the biggest risk factor in the financial services and manufacturing sectors, and compliance with laws for Health & Pharma. For Technology, however, tax representations account for the majority of claims at 25%, with IP following in trail at 19%. This is most likely the result of increased risk exposure due to the numerous tax jurisdictions involved in these deals.
Most of our clients understand by now that RWI is not a replacement for sound diligence practices. This chart serves as a tool to be used when evaluating potential risks and the impact on an asset’s valuation.
Conclusion
Our advice to clients remains the same. Collaborate with your broker, counter-party, and insurer during the diligence process to uncover potential claims before closing. Should a potential claim arise, contact your broker immediately for guidance.
While this is certainly a lot of information to digest, I trust this will shed some light on risk areas to take into consideration when moving forward with an acquisition. Don’t hesitate to reach out if there is any way we can support you in the future.
Author

Table of Contents