

Report
Securities Class Actions 2024 Recap: An Uptick in Filings Plus Record-Breaking Settlements [Report]
 Priya Cherian Huskins, Esq.
 Feb 11, 2025

As 2024 came to a close, securities class actions (SCA) remained a concern for public companies and their directors and officers.
The numbers are in, and according to the latest research in Woodruff Sawyer’s D&O Databox 2024 Year-End Report, 2024 marked another year of increased filings—along with record-breaking settlement dollars.
As always, we are keeping a close eye on these trends, including the implications they may have for D&O insurance.
Five Years of Peaks and Valleys
Securities class action filings have fluctuated significantly over the past five years, driven by court rulings, market cycles, and shifting plaintiff strategies.
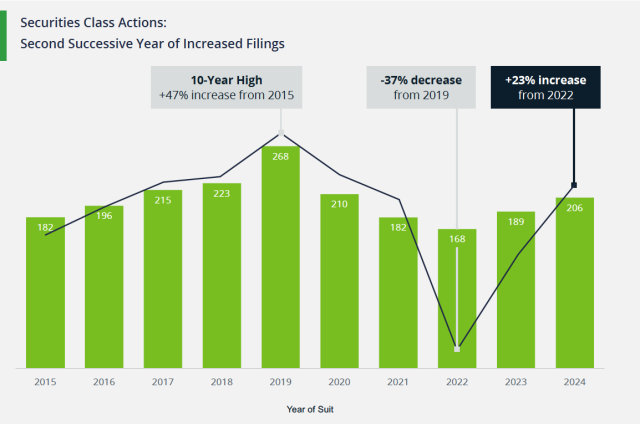
In 2019, we saw a surge in filings, largely driven by the Cyan ruling, which allowed plaintiffs to bring Section 11 claims against IPO companies in both state and federal courts. This led to a wave of parallel filings, pushing total SCA cases to a decade high.
By 2021, an unprecedented IPO boom saw 1,013 companies going public—613 of them via SPACs. Many of these companies became litigation targets, contributing to over a third of all filings in 2021 and 2022.
Then came the slowdown. In 2022, IPO activity plummeted to just 174 companies, and litigation followed suit.
But another factor played a major role: the Sciabacucchi decision in 2020, which upheld choice of forum provisions, largely shutting down the ability to file parallel Section 11 claims in state courts for companies that adopted federal choice of forum provisions.
This made the Cyan problem essentially go away. As a result, parallel federal and state court filings related to IPOs fell from 60% in 2020 to zero in 2022.
Despite the sluggish IPO market, filings climbed again in 2023 and 2024—but with a different focus. Instead of targeting newly public companies, plaintiffs shifted toward large, well-established corporations across industries.
In addition, new angles for SCAs included AI-related issues, such as “AI washing" (overhyping AI capabilities). The percentage of SCAs tied to AI increased from 4% in 2023 to 7% in 2024.
Regardless of how 2025 shapes up, one thing is clear: the plaintiffs’ bar continues to innovate, and SCAs are not going away.
Filing Activity by Size and Industry
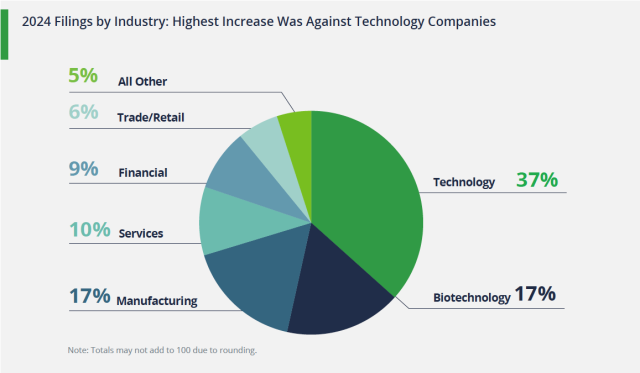
In 2024, securities class action filings targeted larger businesses across familiar industries. SCA trends in 2024 included the following:
- Market cap: Lawsuits against large-cap companies (greater than $10 billion) have remained steady compared to 2023. However, this group saw the highest increase over the 10-year average, with a notable gain of five percentage points.
- Industry trends: Technology remains the most frequently sued industry, surpassing its 10-year average by six percentage points.
High-Profile Brands Sued in 2024
High-profile brands took center stage in 2024’s securities litigation, with household names across various sectors facing lawsuits. Among the companies sued were:
- Technology: Intel, Snowflake, CrowdStrike
- Retail: Starbucks, Walgreens, Dick’s Sporting Goods
- Biotech: Moderna, AstraZeneca, Biogen
- Manufacturing: Toyota, Boeing, Rivian
This is just a partial list. What is interesting is that on average, these companies had a market cap of $89 billion and had been in business for 27 years, underscoring the shift in SCA's focus toward mature public companies.
A Record-Breaking Year for Settlements
While an increase in filings is significant, what truly set 2024 apart was the scale of settlements. The total settlement amount reached $4.1 billion—the highest annual figure in securities class action history, excluding cases with individual settlements exceeding $1 billion.
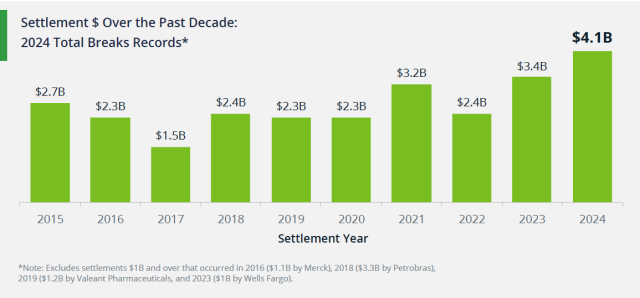
Interestingly, rather than a surge in the number of settlements, it was the size of the payouts that drove this record-breaking year.
Large settlements played a dominant role, with technology companies alone accounting for $2 billion in payouts. In fact, six of the top 10 settlements in 2024 came from the tech sector.
What This Means for 2025
The coming year will likely be more of the same: a gradual uptick in SCAs. However, if the IPO market gets momentum, that could mean even more filings in 2025 than expected.
And, with approximately 500 unresolved cases in the pipeline—many involving large-cap companies—settlement dollars are likely to remain high in the coming years.
As we head into 2025, the question is not whether securities litigation will persist but how companies can best prepare for the risks ahead. For directors and officers, that means a solid D&O insurance program.
For now, the D&O insurance market remains favorable for insureds. However, one wonders how long this will continue given the increase in SCAs and large-dollar settlements to boot. For more on this important topic, see our D&O Looking Ahead Guide for 2025.
Learn More
To dive deeper into SCA trends and their impact, the full D&O Databox 2024 Year-End Report covers several other key areas in detail, including:
- International litigation trends
- COVID-19’s lingering legal impact
- De-SPAC lawsuits on the decline
- The rise of AI washing litigation
- Settlement breakdown by industry
- Dismissals versus settlements
- Market cap breakdown of open cases
- US versus international lawsuits
For a full analysis of these trends and more, access the D&O Databox 2024 Year-End Report.
Author

Table of Contents