

Blog
How Your Experience Modification Rate Impacts Your Insurance Premiums and Business
 Debbie Hammer
 Dec 14, 2023

Your business’s experience modification rating (ex-mod) directly translates to premium dollars, and risk managers and executives could benefit from a basic understanding of how ex-mods are calculated. The ex-mod reflects an organization’s injury history as compared to that of its industry peers of the same size. Insurance carriers use this metric to forecast future risk, and it is one of the factors used in calculating workers’ compensation (WC) premiums.

Certain industries, particularly construction, rely on the ex-mod as a key indicator of a company’s health and safety practices when bidding for jobs. A company can lose a bid simply because it has a high ex-mod. But are ex-mods a true reflection of your company’s health and safety program? This article will demystify experience modification rating by exploring basic principles and simplifying analysis and application.
Ex-Mod 101: Eligibility and Insurance Premiums
For businesses that qualify, experience modification ratings are mandatory. Whether a company is ex-mod-eligible depends on whether it meets the state rating bureau’s eligibility threshold, which is adjusted annually based on wage inflation and average claim costs. The state establishes the job classification codes and loss rates based on statistical data provided by insurance carriers. It is possible for an employer to be eligible in some states but not others, depending on its payroll in different states and the eligibility threshold used by those states' rating systems.
Insurance carriers do not decide ex-mods. Instead, ex mod rating is regulated by state rating agencies, such as California’s Workers’ Compensation Insurance Rating Bureau (WCIRB) and the National Council of Compensation Insurance (NCCI). Some states have their own independent rating bureau.
The insurance carrier is responsible for submitting payroll and claims data to the state. This is called unit statistical reporting or “unit stat.” The insurance carrier first reports the data to the state 18 months after the policy inception month and annually thereafter. If your policy inception date is January 1, 2000, your carrier would submit unit stat data in July of every year. It is a snapshot of your claim data at a specific time and is valued on a specific date of the month. Depending on the insurance carrier, the losses could be valued on the first or the last day of the month. The WCIRB or NCCI then publishes the ex-mod rating, and the insurance carrier uses this data as part of its premium estimate. Policies stay in the formula for three years.
While there are rare exceptions (e.g., change in policy term), ex-mods typically use three completed policy terms of payroll and corresponding claim data. The current policy term is not used in the formula because at the time of unit stat, the policy term is incomplete.
What Is the Experience Period?
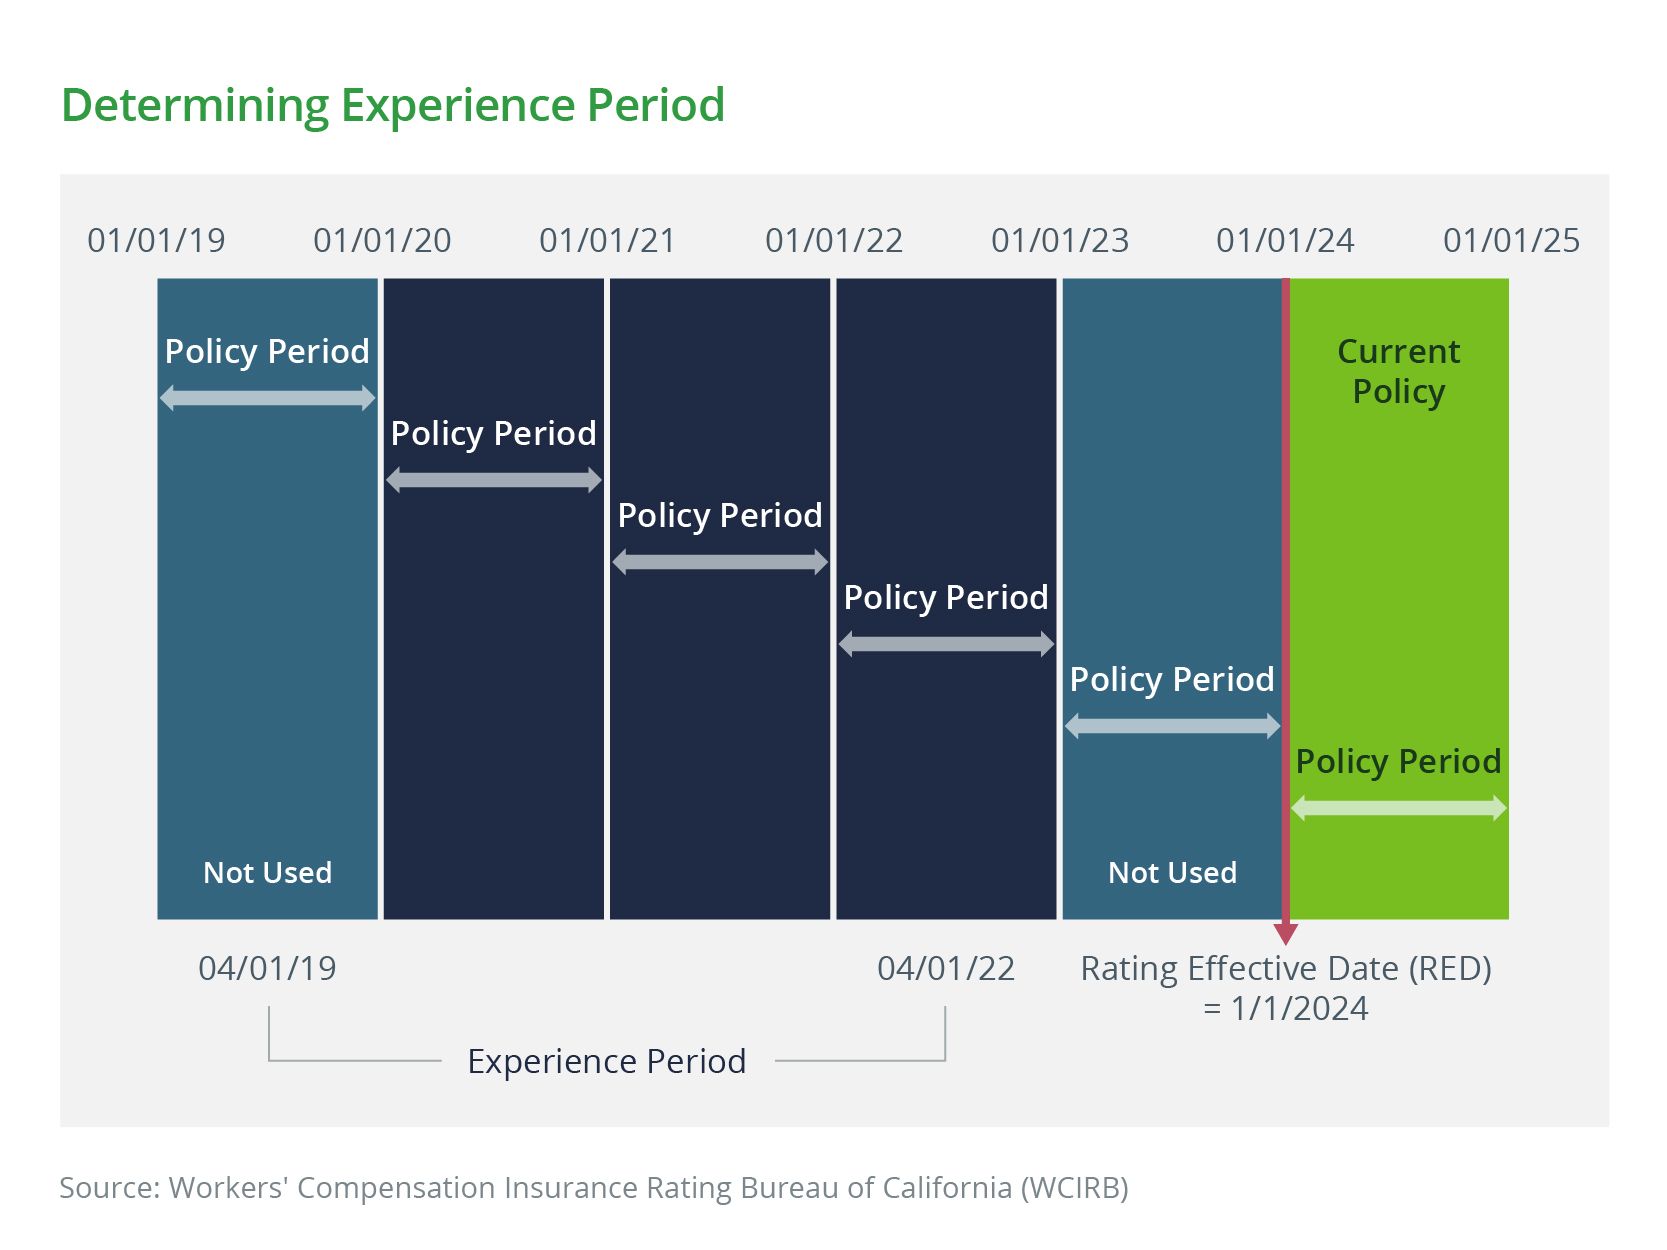
Experience Period: The data used to calculate your ex-mod is determined by your company's rating effective date and corresponds to your policy effective date. For example, if your policies always start on January 1, your rating effective date would be January 1. Your rating effective date determines the experience period and the effective date of your ex-mod. The experience period begins four years and nine months prior to your rating effective date and terminates one year and nine months prior to the rating effective date. If your rating effective date is January 1, 2024, the experience period is April 1, 2019 to April 1, 2022.
Three policy terms typically go into the formula. However, if your company switched inception dates or has multiple concurrent policies with varying inception dates, you could have more than three policies in the formula.
For companies with only one policy effective date, with each new effective date, the oldest policy term on the worksheet will drop out of the formula and a new completed policy term will be added.
Breaking Down the Ex-Mod Formula
It’s easy to get caught in the weeds when analyzing ex-mods. Keeping it simple, the basic formula is:
|
Experience Modification = Actual Losses / Expected Losses |
Actual losses are measured by claim reserves over a three-year period. Expected losses are measured by company payroll and loss rates for the same three-year period.
An ex-mod of 1.00 is considered average, and the lower the number is, the better. An ex-mod of less than 1.00 is better than average while an ex-mod greater than 1.00 is worse than average. The higher or lower the ex-mod is above or below 1.00, the more it impacts your premium. For example, an ex-mod of 1.50 will have a more adverse effect on your premium than an ex-mod of 1.05.
An unfavorable ex-mod can trigger panic or dread. But by knowing what matters and what does not, and what you can and cannot control, you can avoid fear and analysis paralysis, facing your ex-mod head-on.
Ex-mods rely on a math formula developed by state rating agencies. Employers have control over certain variables, but not others. Here is a quick breakdown of some of the factors driving ex-mod results that employers can and cannot control.
Mostly Controllable Factors
-
- Claims. Employers have more control over injury frequency, or the number of injuries in the workplace. Employers have less control over injury severity once an injury occurs. This is why safety and loss prevention to prevent injuries from happening in the first place is so important. Inherent in experience rating is the knowledge that the cost of specific incidents is less predictable than the fact that the incident occurred. Hence, the ex-mod formula gives greater weight to claim frequency than severity.
Sometimes, freak accidents outside of an employer’s control may occur. The ex-mod formula is also built with this in mind and sets maximum limits on individual claims. - Payroll. Of course, employers do control what they pay employees, and payroll size is a measure of organizational health, growth, and productivity. However, external factors like the economy and pandemics can also lead to a reduction in force (RIF) and an overall decline in payroll, which impacts the ex-mod.
- Claims. Employers have more control over injury frequency, or the number of injuries in the workplace. Employers have less control over injury severity once an injury occurs. This is why safety and loss prevention to prevent injuries from happening in the first place is so important. Inherent in experience rating is the knowledge that the cost of specific incidents is less predictable than the fact that the incident occurred. Hence, the ex-mod formula gives greater weight to claim frequency than severity.
Uncontrollable Factors
- Loss rates. Loss rates are the anticipated costs of injuries established by the state based on annual injury metrics. Anticipated losses in the ex-mod represent the result of payroll, multiplied by 100 times the loss rate for each job classification in a company. The state also sets classification codes. When there is a change in the number of employees or payroll and a change in the loss rates, the overall anticipated losses may vary. In theory, if the expected losses are reduced, then the actual losses are likely to be reduced proportionately. Otherwise, the ex-mod will rise.
- Math. Experience rating uses multiple weights and ratios to calculate an employer’s ex-mod. An example is the D ratio. The purpose of the D ratio is to obtain an employer’s expected primary losses. Like loss rates, the D ratio is another state-established variable that is assigned to each classification code. This ratio is intended to discount the cost of severe claims. If there is a decrease in the D ratios, the expected primary losses will be lower. If the actual primary losses are not proportionately reduced relative to the expected primary losses, the ex-mod may increase.
Why Did My Experience Modification Rate Go Up or Down?
Making sense of an ex-mod can be a daunting task. To make it easier, take a step-by-step approach and concentrate on relevant information.
Our clients often ask us why their ex-mod increased or decreased year over year. If your ex-mod is under 1.00, it may not be as important to determine why your ex-mod decreased from the previous year. However, when your ex-mod spikes and is over 1.00, you can ask your Woodruff Sawyer consultant to provide you with a full analysis. We search for the devil in the details.
We compare the overall payroll for the last three years in the current ex-mod effective year to the overall payroll in the prior year’s ex-mod. Did it go up or down? If the payroll decreased, this could be a reason for an increase in the ex-mod. We may compare payroll by individual policy years in each ex-mod. Did last year’s payroll increase, but the overall three-year total decreased compared to the prior year’s rating? This is a common phenomenon recently because of the pandemic years.
Next, we compare the expected losses to the actual losses between the current and the previous year’s ex-mods. We do the same comparison for the ratio of expected primary losses to actual primary losses. If actual losses are higher than expected, chances are the ex-mod will be higher. We may also conduct a claim frequency and severity analysis by policy year to see if claims are trending up or down.
We will differentiate last year’s loss rates and D ratios from this year’s. Did they go up or down? If they go down, the ex-mod may be higher.
When Bad Ex-Mods Happen to Good Employers
Employers with few to no claims with ex-mods greater than 1.00 are often befuddled, and rightfully so.
| It is possible to have good safety practices but a higher ex-mod. But the ex-mod isn’t all that defines an employer. Inherently, the ex-mod formula can seem like a funny mirror that distorts the truth. |
A high ex-mod is not always a true reflection of a company’s safety culture or claims management practices. Sometimes uncontrollable factors are at play. WC claims are costly, and it is easy for a muscle strain to turn into a $50,000 claim. This type of claim doesn’t reflect a company’s safety culture or loss prevention strategies, but unfortunately, the employer is penalized for such claims. While this can be frustrating, our best advice is to focus on what you have control over.
Taking Charge: Steps to Take for an Optimal Ex-Mod
Employers concerned about their ex-mod can take action to improve their safety statistics. These include:
- Start with hiring practices. You can reduce accident frequency by prescreening candidates using background checks, fitness for duty, and drug tests after making a job offer. These must be done in accordance with state and federal requirements, including HIPAA, Americans with Disabilities Act (ADA), and privacy concerns. Consult legal counsel on all recruitment procedures.
- Re-evaluate safety regularly. Is your current program effective at preventing injuries? Where are the gaps? Are there advances in safety protocols or technology that could be implemented? Train all new workers in safety procedures and provide refresher training for existing workers. Teach employees situational and mindful awareness as part of your safety program.
- Improve wellness culture. Healthy employees are less likely to get injured and less likely to have severe injuries.
- Offer transitional light duty to injured workers. This can be in the form of modified or alternate work or not-for-profit work and may reduce temporary disability claim costs, thereby decreasing the ex-mod.
- Ensure proper oversight of claims management. This reduces the chance of claims going off the rails and adversely affecting the ex-mod. Reserve evaluations are important prior to a unit stat to ensure the claims are not overvalued. A claim involving an initial recommendation for surgery that is now deemed unnecessary is one such example of an opportunity to reduce reserves.
Key Takeaways
An employer’s ex-mod directly impacts premium. To control the ex-mod, employers can adopt safety measures and claim handling best practices, which may lead to reduced premiums.
However, ex-mods are not the only premium pricing mechanism available. Employers can also leverage strategies such as return to work (RTW) or loss control efforts to negotiate discounts with underwriters.
If you would like more information about this topic, insurance services, WC, or employee benefits, contact your Woodruff Sawyer service team.
Author

Table of Contents