Blog
More Insight into the 10-Year High in Securities Class Actions
In January, we previewed our findings about what we’re seeing in the securities class action landscape from Woodruff Sawyer’s proprietary D&O DataBox™. In that post, we noted that 2017 had the highest number of filings in the past 10 years.
This week, we’re releasing our quarterly Flash Report with additional data on 2017 securities class action trends. (As a reminder, the Woodruff Sawyer Flash Report looks at securities class action suits against issuers of common or preferred stock listed in the United States.)
In this edition of the Flash Report, we dive into more detail on trends like:
- The types of companies being sued, including by industry, country and market capitalization
- The change in dismissal and settlement dynamics
- The changing venue for securities class actions, including state courts
Download your copy and keep reading for some highlights …
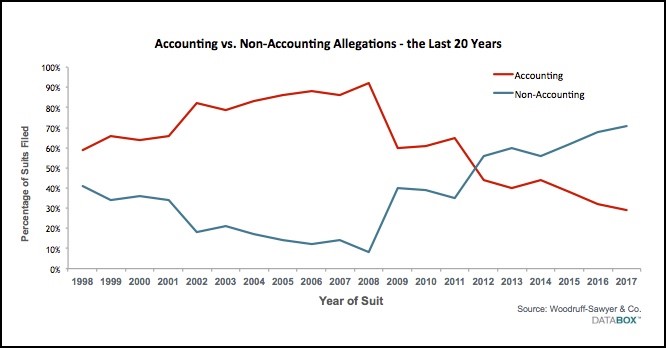
Last time, we mentioned the dramatic shift from accounting to non-accounting allegations in these types of lawsuits. Let’s look a little closer at that trend now.
Scandals like Enron led to the Sarbanes-Oxley Act of 2002 aka the "Public Company Accounting Reform and Investor Protection Act." Fifteen years later, companies sometimes still face these types of allegations, but the filings have dropped to a 10-year average of 48 percent. This is in comparison to the previous decade when these types of allegations made up an average of 76 percent of securities class action cases.
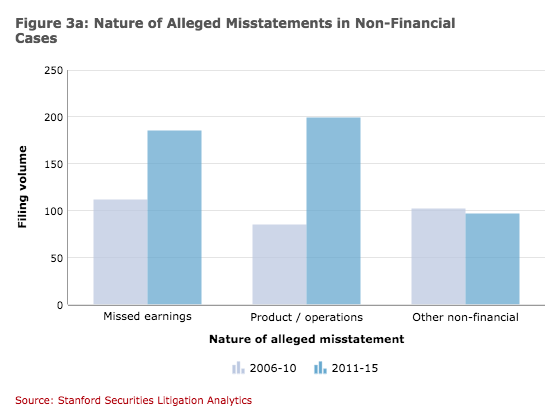
Plaintiffs have shifted focus to allegations such as misrepresentations in revenue growth (such as when quarterly results or projected revenue forecasts did not meet expectations), in addition to product and operational issues.
In their analysis of class action filings from 2006 to 2015, Michael Klausner, Professor of Law at Stanford Law School and Jason Hegland, Executive Director of Stanford Securities Litigation Analytics noted this trend as well:
The most common type of non-financial cases are those involving missed earnings and those involving statements about products or operations. Both missed earnings cases and product and operations cases accounted for most of the increase in non-financial cases over the 2006 to 2015 period.
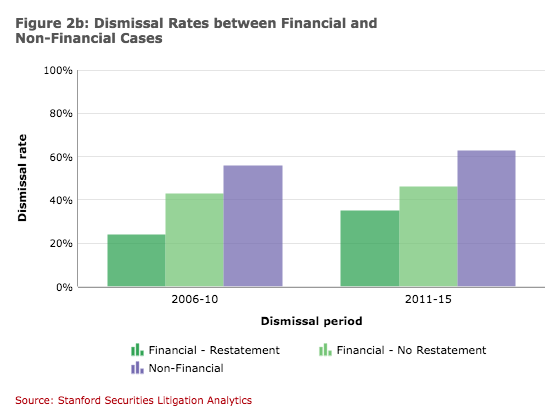
Dismissal rates are up, and as noted in the Stanford analysis, most dismissals are related to non-accounting allegations.
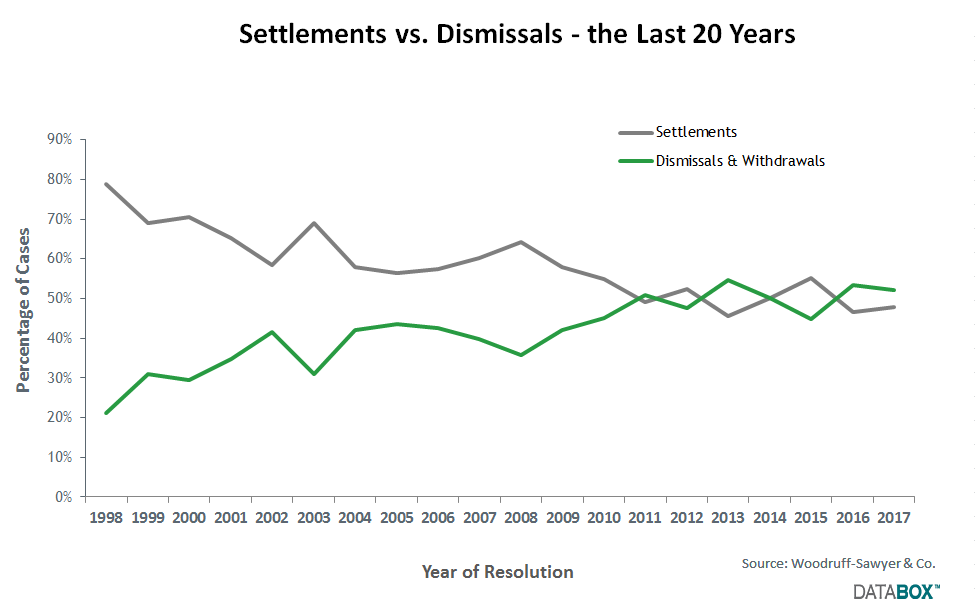
Our analysis showed a convergence of settlements and dismissal rates. This is in contrast with the past 13 years, where settlements were higher than dismissals. Again, this can be traced back to the decline in accounting allegations (which were more likely to be settled than to be dismissed).
And even though data show that the frequency of settlements is down, when these class action suits do settle, it has been for more money—about $9 million more from 2008 through 2017 on average when compared to 1998 to 2007.
At the moment, we don’t anticipate that securities class action filings in 2018 will exceed the total number of filings in 2017; however, there’s no doubt that litigation activity will continue at a brisk pace.
For more on securities class action trends download your copy of the Flash Report.
Author
Table of Contents


